Observability Dev Services with Grafana OTel LGTM
This Dev Service provides the Grafana OTel-LGTM, an all-in-one Docker image containing an OpenTelemetry Collector receiving and then forwarding telemetry data to Prometheus (metrics), Tempo (traces) and Loki (logs).
This data can then be visualized by Grafana. The LGTM abbreviation stands for:
Configuring your project
Add the Quarkus Grafana OTel LGTM sink (where data goes) extension to your build file:
<dependency>
    <groupId>io.quarkus</groupId>
    <artifactId>quarkus-observability-devservices-lgtm</artifactId>
    <scope>provided</scope>
</dependency>implementation("io.quarkus:quarkus-observability-devservices-lgtm")Micrometer
The Micrometer Quarkus extension provides metrics from automatic instrumentation implemented in Quarkus and its extensions.
There are multiple ways to output Micrometer metrics. Next there are some examples:
Using the Micrometer Prometheus registry
This is the most common way to output metrics from Micrometer and the default way in Quarkus. The Micrometer Prometheus registry will publish data in the /q/metrics endpoint and a scraper inside the Grafana LGTM Dev Service will grab it (pull data from the service).
<dependency>
    <groupId>io.quarkus</groupId>
    <artifactId>quarkus-micrometer-registry-prometheus</artifactId>
</dependency>implementation("io.quarkus:quarkus-micrometer-registry-prometheus")Using the Micrometer OTLP registry
The Quarkiverse Micrometer OTLP registry will output data using the OpenTelemetry OTLP protocol to the Grafana LGTM Dev Service. This will push data out of the service:
<dependency>
    <groupId>io.quarkiverse.micrometer.registry</groupId>
    <artifactId>quarkus-micrometer-registry-otlp</artifactId>
</dependency>implementation("io.quarkiverse.micrometer.registry:quarkus-micrometer-registry-otlp")When using the Micrometer’s Quarkiverse OTLP registry to push metrics to Grafana OTel LGTM, the quarkus.micrometer.export.otlp.url property is automatically set to OTel collector endpoint as seen from the outside of the Docker container.
OpenTelemetry
With OpenTelemetry, metrics, traces and logs can be created and sent to the Grafana LGTM Dev Service.
By default, the OpenTelemetry extension will produce traces. Metrics and logs must be enabled separately.
The quarkus-opentelemetry extension can be added to your build file like this:
<dependency>
    <groupId>io.quarkus</groupId>
    <artifactId>quarkus-opentelemetry</artifactId>
</dependency>implementation("io.quarkus:quarkus-opentelemetry")The quarkus.otel.exporter.otlp.endpoint property is automatically set to the OTel collector endpoint as seen from the outside of the Docker container.
The quarkus.otel.exporter.otlp.protocol is set to http/protobuf.
Micrometer to OpenTelemetry bridge
This extension provides Micrometer metrics and OpenTelemetry metrics, traces and logs. All data is managed and sent out by the OpenTelemetry extension.
All signals are enabled by default.
The extension can be added to your build file like this:
<dependency>
    <groupId>io.quarkus</groupId>
    <artifactId>quarkus-micrometer-opentelemetry</artifactId>
</dependency>implementation("io.quarkus:quarkus-micrometer-opentelemetry")Grafana
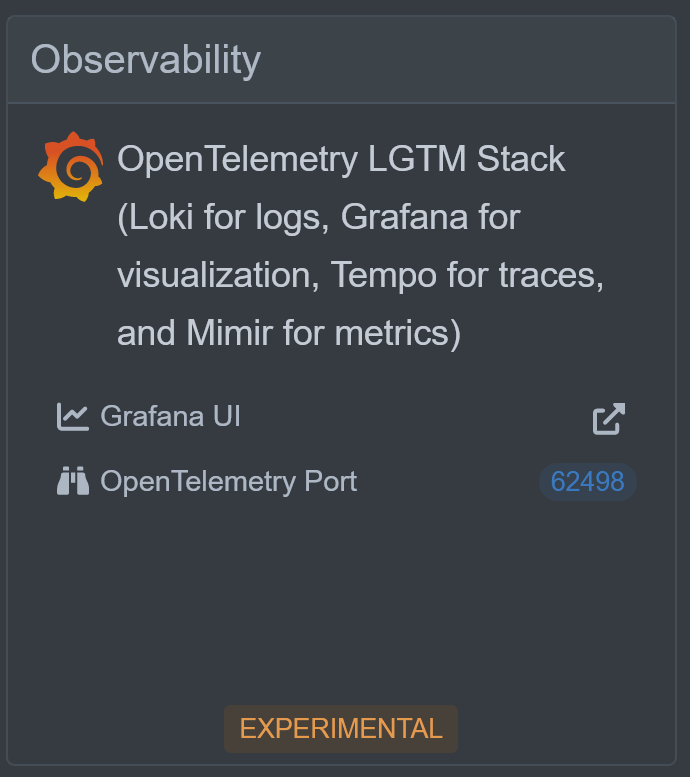
Grafana UI access
Once you start your app in dev mode:
quarkus dev./mvnw quarkus:dev./gradlew --console=plain quarkusDevYou will see a log entry like this:
[io.qu.ob.de.ObservabilityDevServiceProcessor] (build-35) Dev Service Lgtm started, config: {grafana.endpoint=http://localhost:42797, quarkus.otel.exporter.otlp.endpoint=http://localhost:34711, otel-collector.url=localhost:34711, quarkus.micrometer.export.otlp.url=http://localhost:34711/v1/metrics, quarkus.otel.exporter.otlp.protocol=http/protobuf}Remember that Grafana is accessible in an ephemeral port, so you need to check the logs to see which port is being used. In this example, the grafana endpoint is grafana.endpoint=http://localhost:42797.
Another option is to use the Dev UI (http://localhost:8080/q/dev-ui/extensions) as the Grafana URL link will be available and if selected it will open a new browser tab directly to the running Grafana instance:
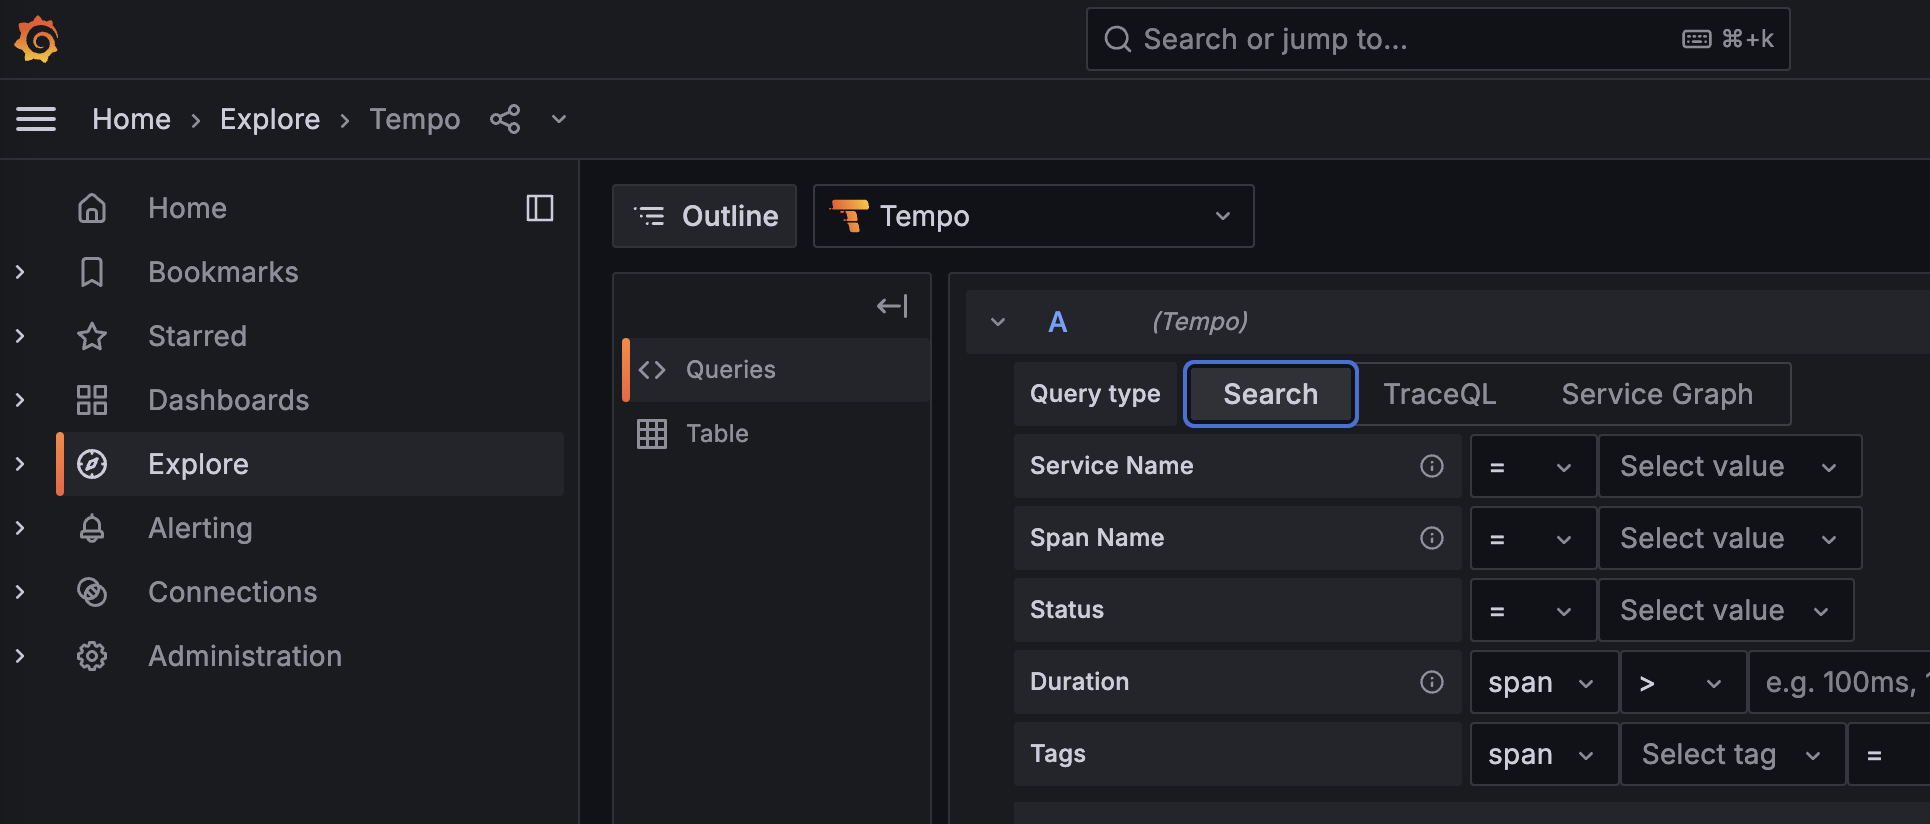
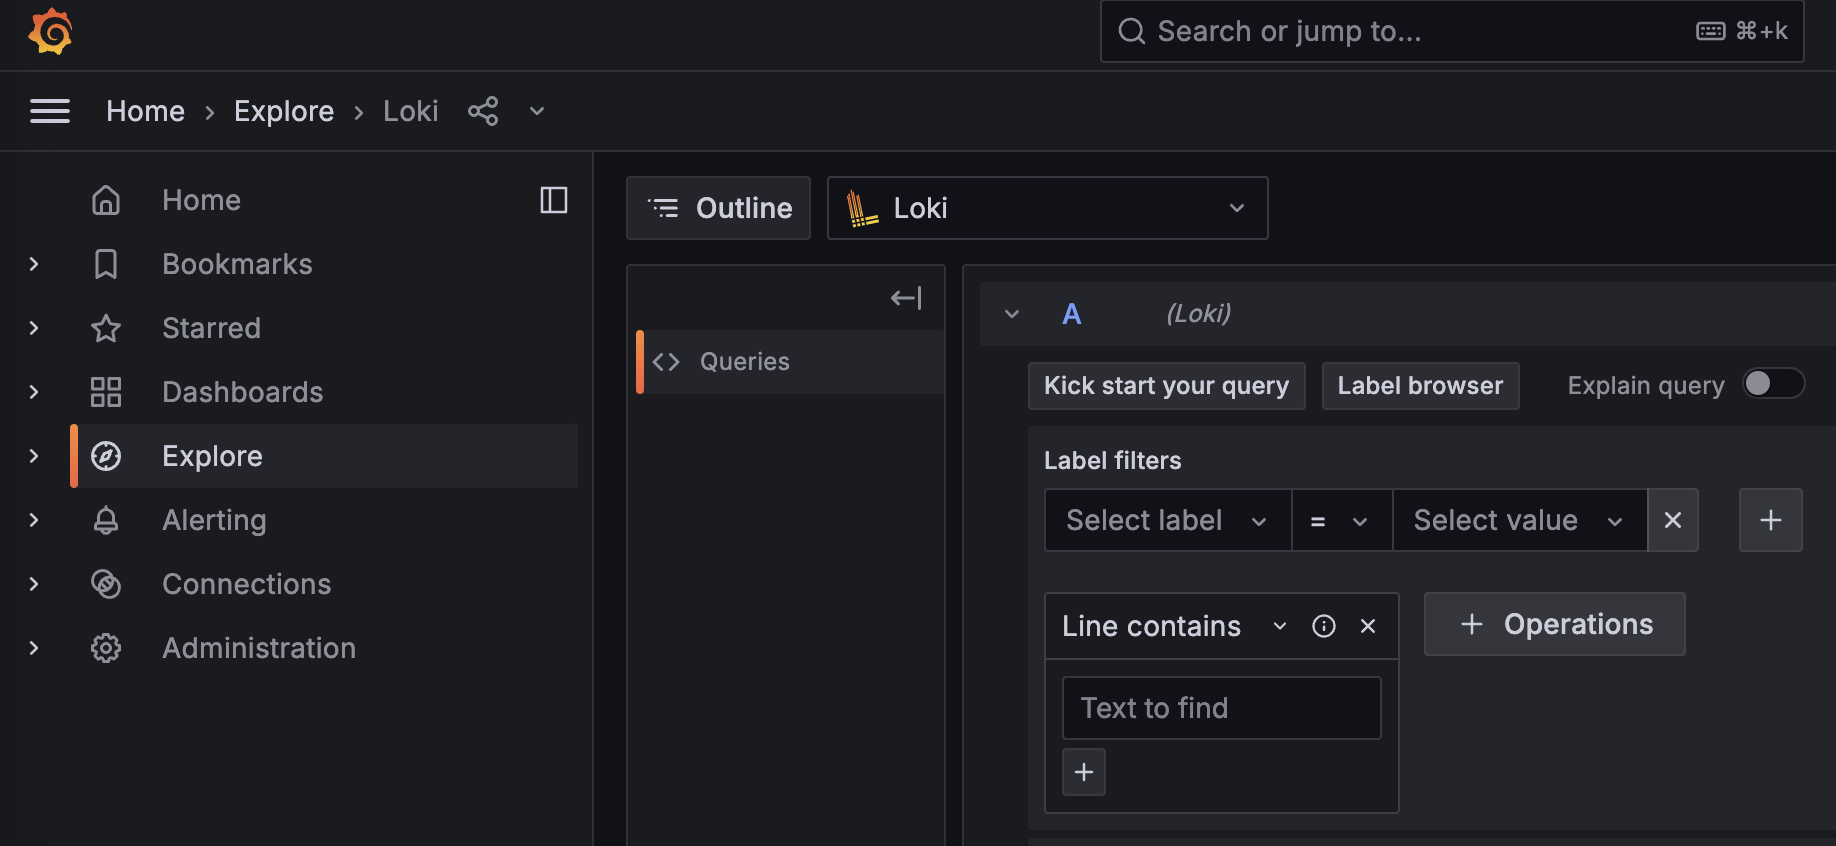
Explore
In the explore section, you can query the data for all the data sources.
To see traces, select the tempo data source and query for data:
For logs, select the loki data source and query for data:
The dashboards
The Dev Service includes a set of dashboards.
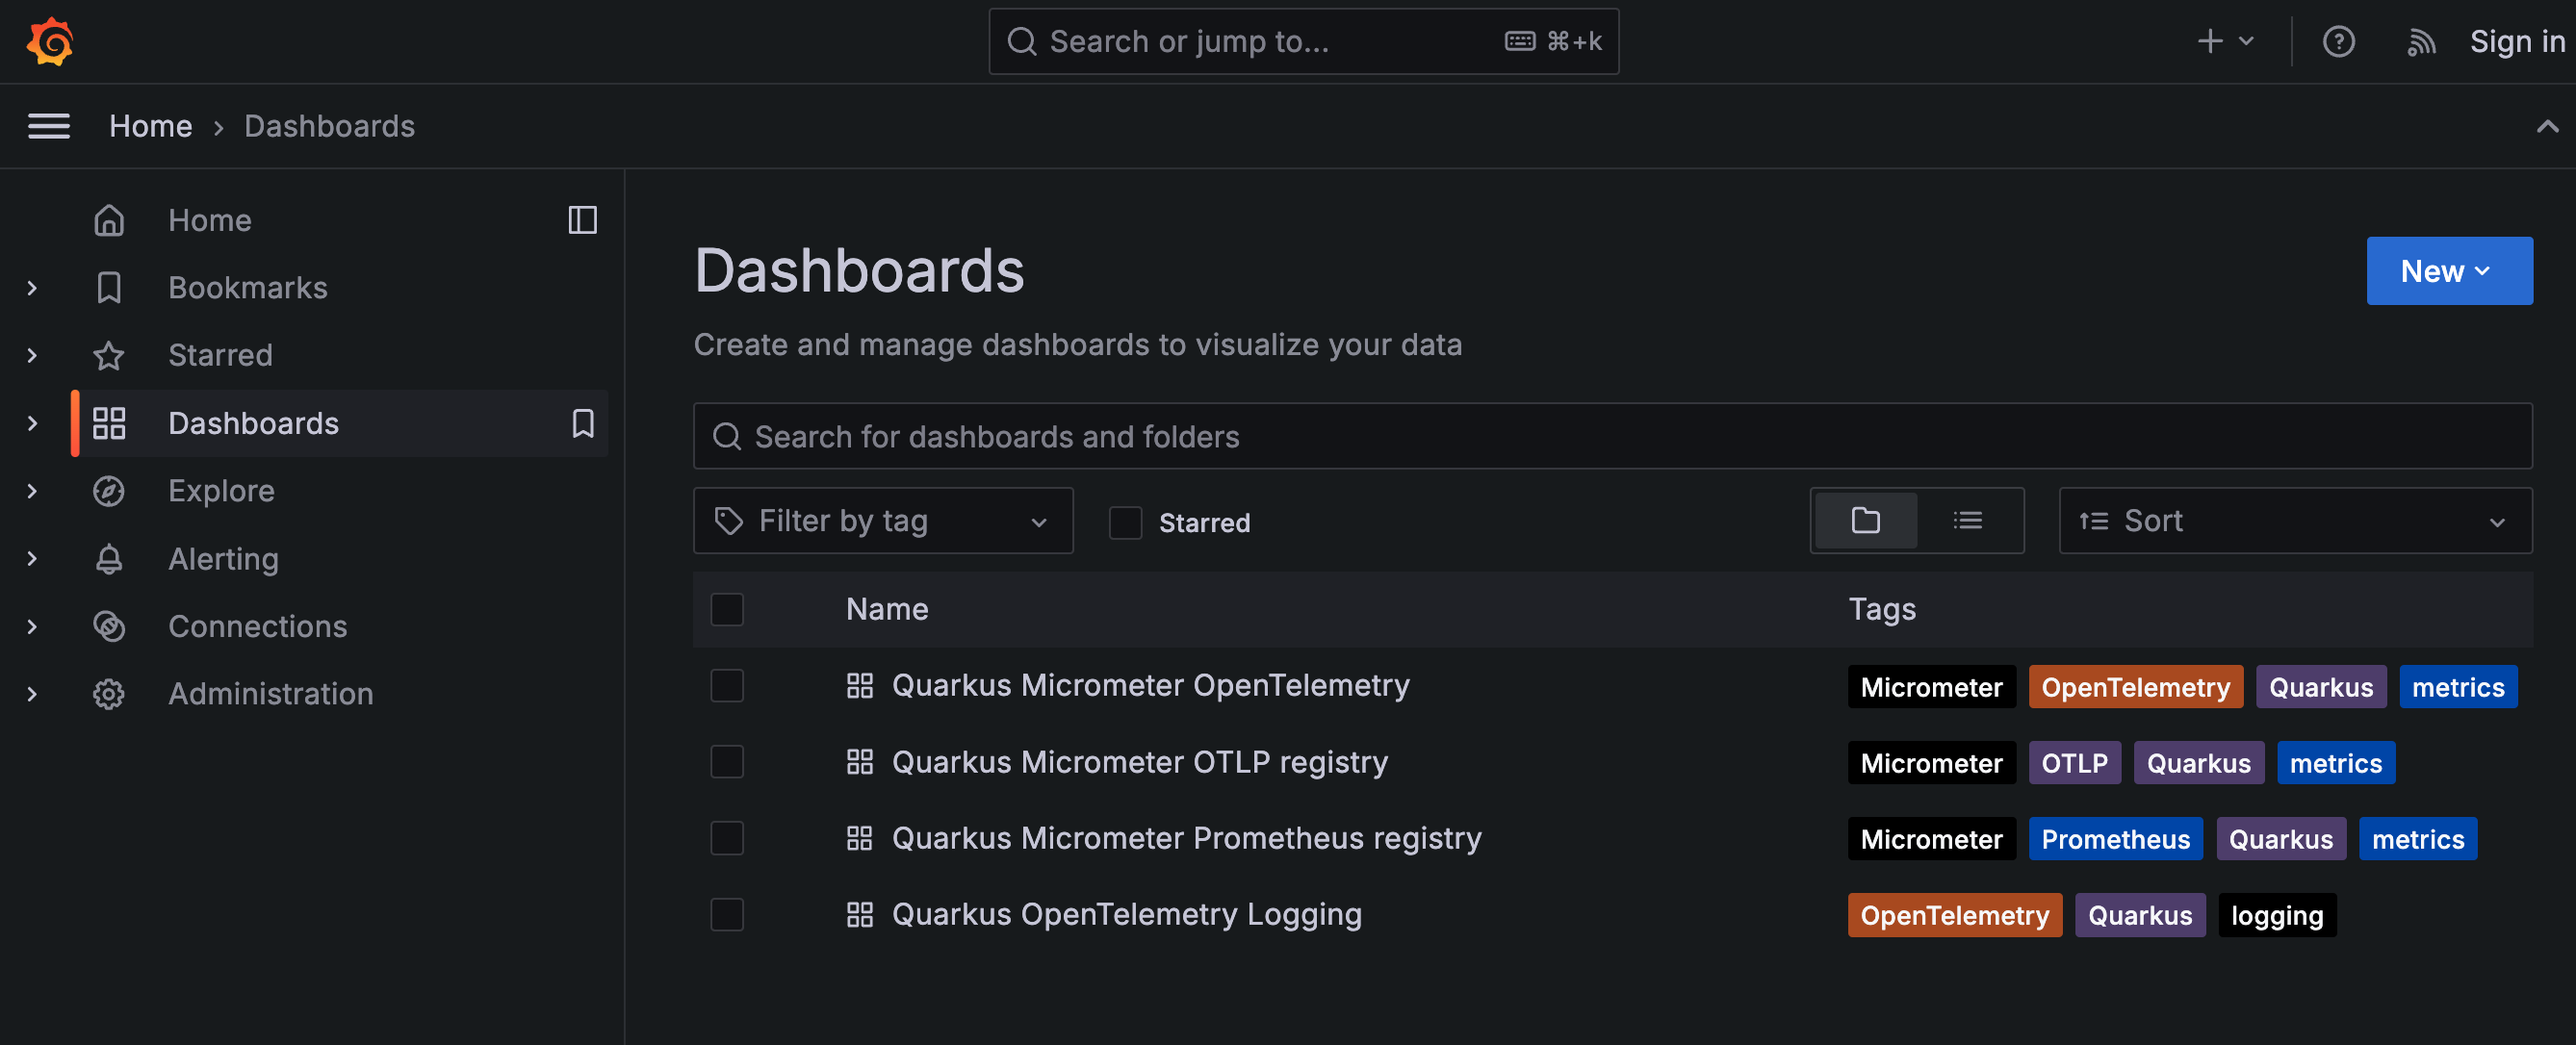
Each dashboard is tuned for the specific application setup. The available dashboards are:
-
Quarkus Micrometer OpenTelemetry: to be used with the Micrometer and OpenTelemetry extension.
-
Quarkus Micrometer OTLP registry: to be used with the Micrometer OTLP registry extension.
-
Quarkus Micrometer Prometheus registry: to be used with the Micrometer Prometheus registry extension.
-
Quarkus OpenTelemetry Logging: to view logs coming from the OpenTelemetry extension.
|
Some panels in the dashboards might take a few minutes to show accurate data when their values are calculated over a sliding time window. |
Custom dashboards
Users can add their own Grafana dashboards with their own configuration.
Place a grafana-dashboard-[your name].json file into the META-INF/grafana directory in your application, and LGTM Dev Services will pick it up automatically, and include this dashboard configuration in the overall Grafana dashboards YAML configuration.
For instance, the /META-INF/grafana/grafana-dashboard-my-simple-prometheus-dashboard.json configuration file creates a dashboard named My Simple Prometheus Dashboard.
Additional configuration
This extension will configure your quarkus-opentelemetry and quarkus-micrometer-registry-otlp extensions to send data to the OTel Collector bundled with the Grafana OTel LGTM image.
If you don’t want all the hassle with Dev Services (e.g. lookup and re-use of existing running containers, etc) you can simply disable Dev Services and enable just Dev Resource usage:
quarkus.observability.enabled=false
quarkus.observability.dev-resources=true
By default Quarkus lets Testcontainers expose random ports for Grafana and OTel, but you can force the usage of user-side fixed ports via setting the ports yourself - but then be aware of port conflicts.
quarkus.observability.lgtm.grafana-port=3001
quarkus.observability.lgtm.otel-grpc-port=5317
quarkus.observability.lgtm.otel-http-port=5318|
Internal container ports stay the same; e.g. 3000 for Grafana, 4317 for OTel gRPC, 4318 for OTel HTTP, etc |
Tests
And for the least 'auto-magical' usage in the tests, simply disable both (Dev Resources are already disabled by default):
quarkus.observability.enabled=falseAnd then explicitly list LGTM Dev Resource in the test as a @QuarkusTestResource resource:
@QuarkusTest
@QuarkusTestResource(value = LgtmResource.class, restrictToAnnotatedClass = true)
@TestProfile(QuarkusTestResourceTestProfile.class)
public class LgtmLifecycleTest extends LgtmTestBase {
}
Testing full Grafana OTel LGTM stack - example
Use existing Quarkus MicroMeter OTLP registry
<dependency>
    <groupId>io.quarkiverse.micrometer.registry</groupId>
    <artifactId>quarkus-micrometer-registry-otlp</artifactId>
</dependency>implementation("io.quarkiverse.micrometer.registry:quarkus-micrometer-registry-otlp")Simply inject the Meter registry into your code — it will periodically push metrics to Grafana LGTM’s OTLP HTTP endpoint.
@Path("/api")
public class SimpleEndpoint {
    private static final Logger log = Logger.getLogger(SimpleEndpoint.class);

    @Inject
    MeterRegistry registry;

    @PostConstruct
    public void start() {
        Gauge.builder("xvalue", arr, a -> arr[0])
                .baseUnit("X")
                .description("Some random x")
                .tag("my_key", "x")
                .register(registry);
    }

    // ...
}
Where you can then check Grafana’s datasource API for existing metrics data.
public class LgtmTestBase {

    @ConfigProperty(name = "grafana.endpoint")
    String endpoint; // NOTE -- injected Grafana endpoint!

    @Test
    public void testTracing() {
        String response = RestAssured.get("/api/poke?f=100").body().asString();
        System.out.println(response);
        GrafanaClient client = new GrafanaClient(endpoint, "admin", "admin");
        Awaitility.await().atMost(61, TimeUnit.SECONDS).until(
                client::user,
                u -> "admin".equals(u.login));
        Awaitility.await().atMost(61, TimeUnit.SECONDS).until(
                () -> client.query("xvalue_X"),
                result -> !result.data.result.isEmpty());
    }

}

// simple Grafana HTTP client

public class GrafanaClient {
    private static final ObjectMapper MAPPER = new ObjectMapper();

    private final String url;
    private final String username;
    private final String password;

    public GrafanaClient(String url, String username, String password) {
        this.url = url;
        this.username = username;
        this.password = password;
    }

    private <T> void handle(
            String path,
            Function<HttpRequest.Builder, HttpRequest.Builder> method,
            HttpResponse.BodyHandler<T> bodyHandler,
            BiConsumer<HttpResponse<T>, T> consumer) {
        try {
            String credentials = username + ":" + password;
            String encodedCredentials = Base64.getEncoder().encodeToString(credentials.getBytes());

            HttpClient httpClient = HttpClient.newHttpClient();
            HttpRequest.Builder builder = HttpRequest.newBuilder()
                    .uri(URI.create(url + path))
                    .header("Authorization", "Basic " + encodedCredentials);
            HttpRequest request = method.apply(builder).build();

            HttpResponse<T> response = httpClient.send(request, bodyHandler);
            int code = response.statusCode();
            if (code < 200 || code > 299) {
                throw new IllegalStateException("Bad response: " + code + " >> " + response.body());
            }
            consumer.accept(response, response.body());
        } catch (IOException e) {
            throw new UncheckedIOException(e);
        } catch (InterruptedException e) {
            Thread.currentThread().interrupt();
            throw new RuntimeException(e);
        }
    }

    public User user() {
        AtomicReference<User> ref = new AtomicReference<>();
        handle(
                "/api/user",
                HttpRequest.Builder::GET,
                HttpResponse.BodyHandlers.ofString(),
                (r, b) -> {
                    try {
                        User user = MAPPER.readValue(b, User.class);
                        ref.set(user);
                    } catch (JsonProcessingException e) {
                        throw new UncheckedIOException(e);
                    }
                });
        return ref.get();
    }

    public QueryResult query(String query) {
        AtomicReference<QueryResult> ref = new AtomicReference<>();
        handle(
                "/api/datasources/proxy/1/api/v1/query?query=" + query,
                HttpRequest.Builder::GET,
                HttpResponse.BodyHandlers.ofString(),
                (r, b) -> {
                    try {
                        QueryResult result = MAPPER.readValue(b, QueryResult.class);
                        ref.set(result);
                    } catch (JsonProcessingException e) {
                        throw new UncheckedIOException(e);
                    }
                });
        return ref.get();
    }
}