MEF and Sofis use Quarkus as core component of a new innovative architecture

About us

The Ministry of Economy and Finance (MEF) of Uruguay is a government ministry.
Website: https://www.gub.uy/ministerio-economia-finanzas

Sofis Solutions is a company with more than 18 years of experience in the digital transformation of Latin American organizations and technological inclusion. Focuses mainly on projects for the development of digital government and the resolution of social, environmental and governance problems.
Website: https://www.sofis.lat
Problem statement
The current Integrated Financial Information System (SIIF) of the Uruguayan Ministry of Economy and Finance relies on Oracle Forms, which presents certain drawbacks such as limited compatibility, inflexibility, high maintenance costs, and limited support. To ensure long-term viability and modernization, an architecture update is needed. The main objective is to establish a scalable reference architecture that enables SIIF to evolve as part of the modernization process. In late 2021 an architecture team was formed, and work began following the TOGAF Architecture Development Method 9.2.
Key requirements
The key requirements of this modernized architecture were:
-
It must be possible to audit transactions and changes made to entities.
-
During runtime, software systems should generate metrics that provide visibility into the operational status of each component. These metrics should be accessible through a centralized monitoring platform, which should enable the visualization of the current status and generation of alerts.
-
Under normal production conditions, the system must respond with a latency of less than one second.
-
A monthly availability of the solution of 99% is required within office hours and 95% outside of office hours.
-
Systems should be able to handle an increasing workload, such as the addition of new user groups, higher volumes of traffic, or more complex transactions, by utilizing horizontal scaling techniques. Services must be deployed as Docker containers.
-
Communication between systems using REST (preferred) and SOAP (legacy) protocols must be supported.
-
Software must be able to be tested on a unitary, integration and system-wide basis.
-
The central data repository of the transactional system must maintain permanent data integrity and consistency. This consistency must be ensured despite technical failures or crashes of other components.
-
All the log data and exceptions must be properly captured and centrally managed.
-
Software that is being developed should be highly configurable to ensure it can be deployed across various installation environments, such as development, testing, pre-production, production, etc. without the need for recompiling it for each environment.
-
Components should easily integrate with distributed event streaming platforms as Kafka.
-
Framework utilized must enhance developer experience. Live reload while coding is highly valuable.
-
Coding must be aligned with Java EE and MicroProfile ecosystems.
-
Components must provide a mechanism that allows health monitoring through the health monitor of the platform.
We selected Quarkus as the framework for our backends based on its ability to fulfill all our critical requirements. Its extensive features, capabilities, and active community were precisely what we were looking for, making it an essential tool for our projects.
Architecture
The architecture diagrams are made following the C4 model. Systems are composed of modules implemented using a macroservices approach that are larger than microservices but smaller than monolithic applications. A simplified version of the system landscape is presented below:
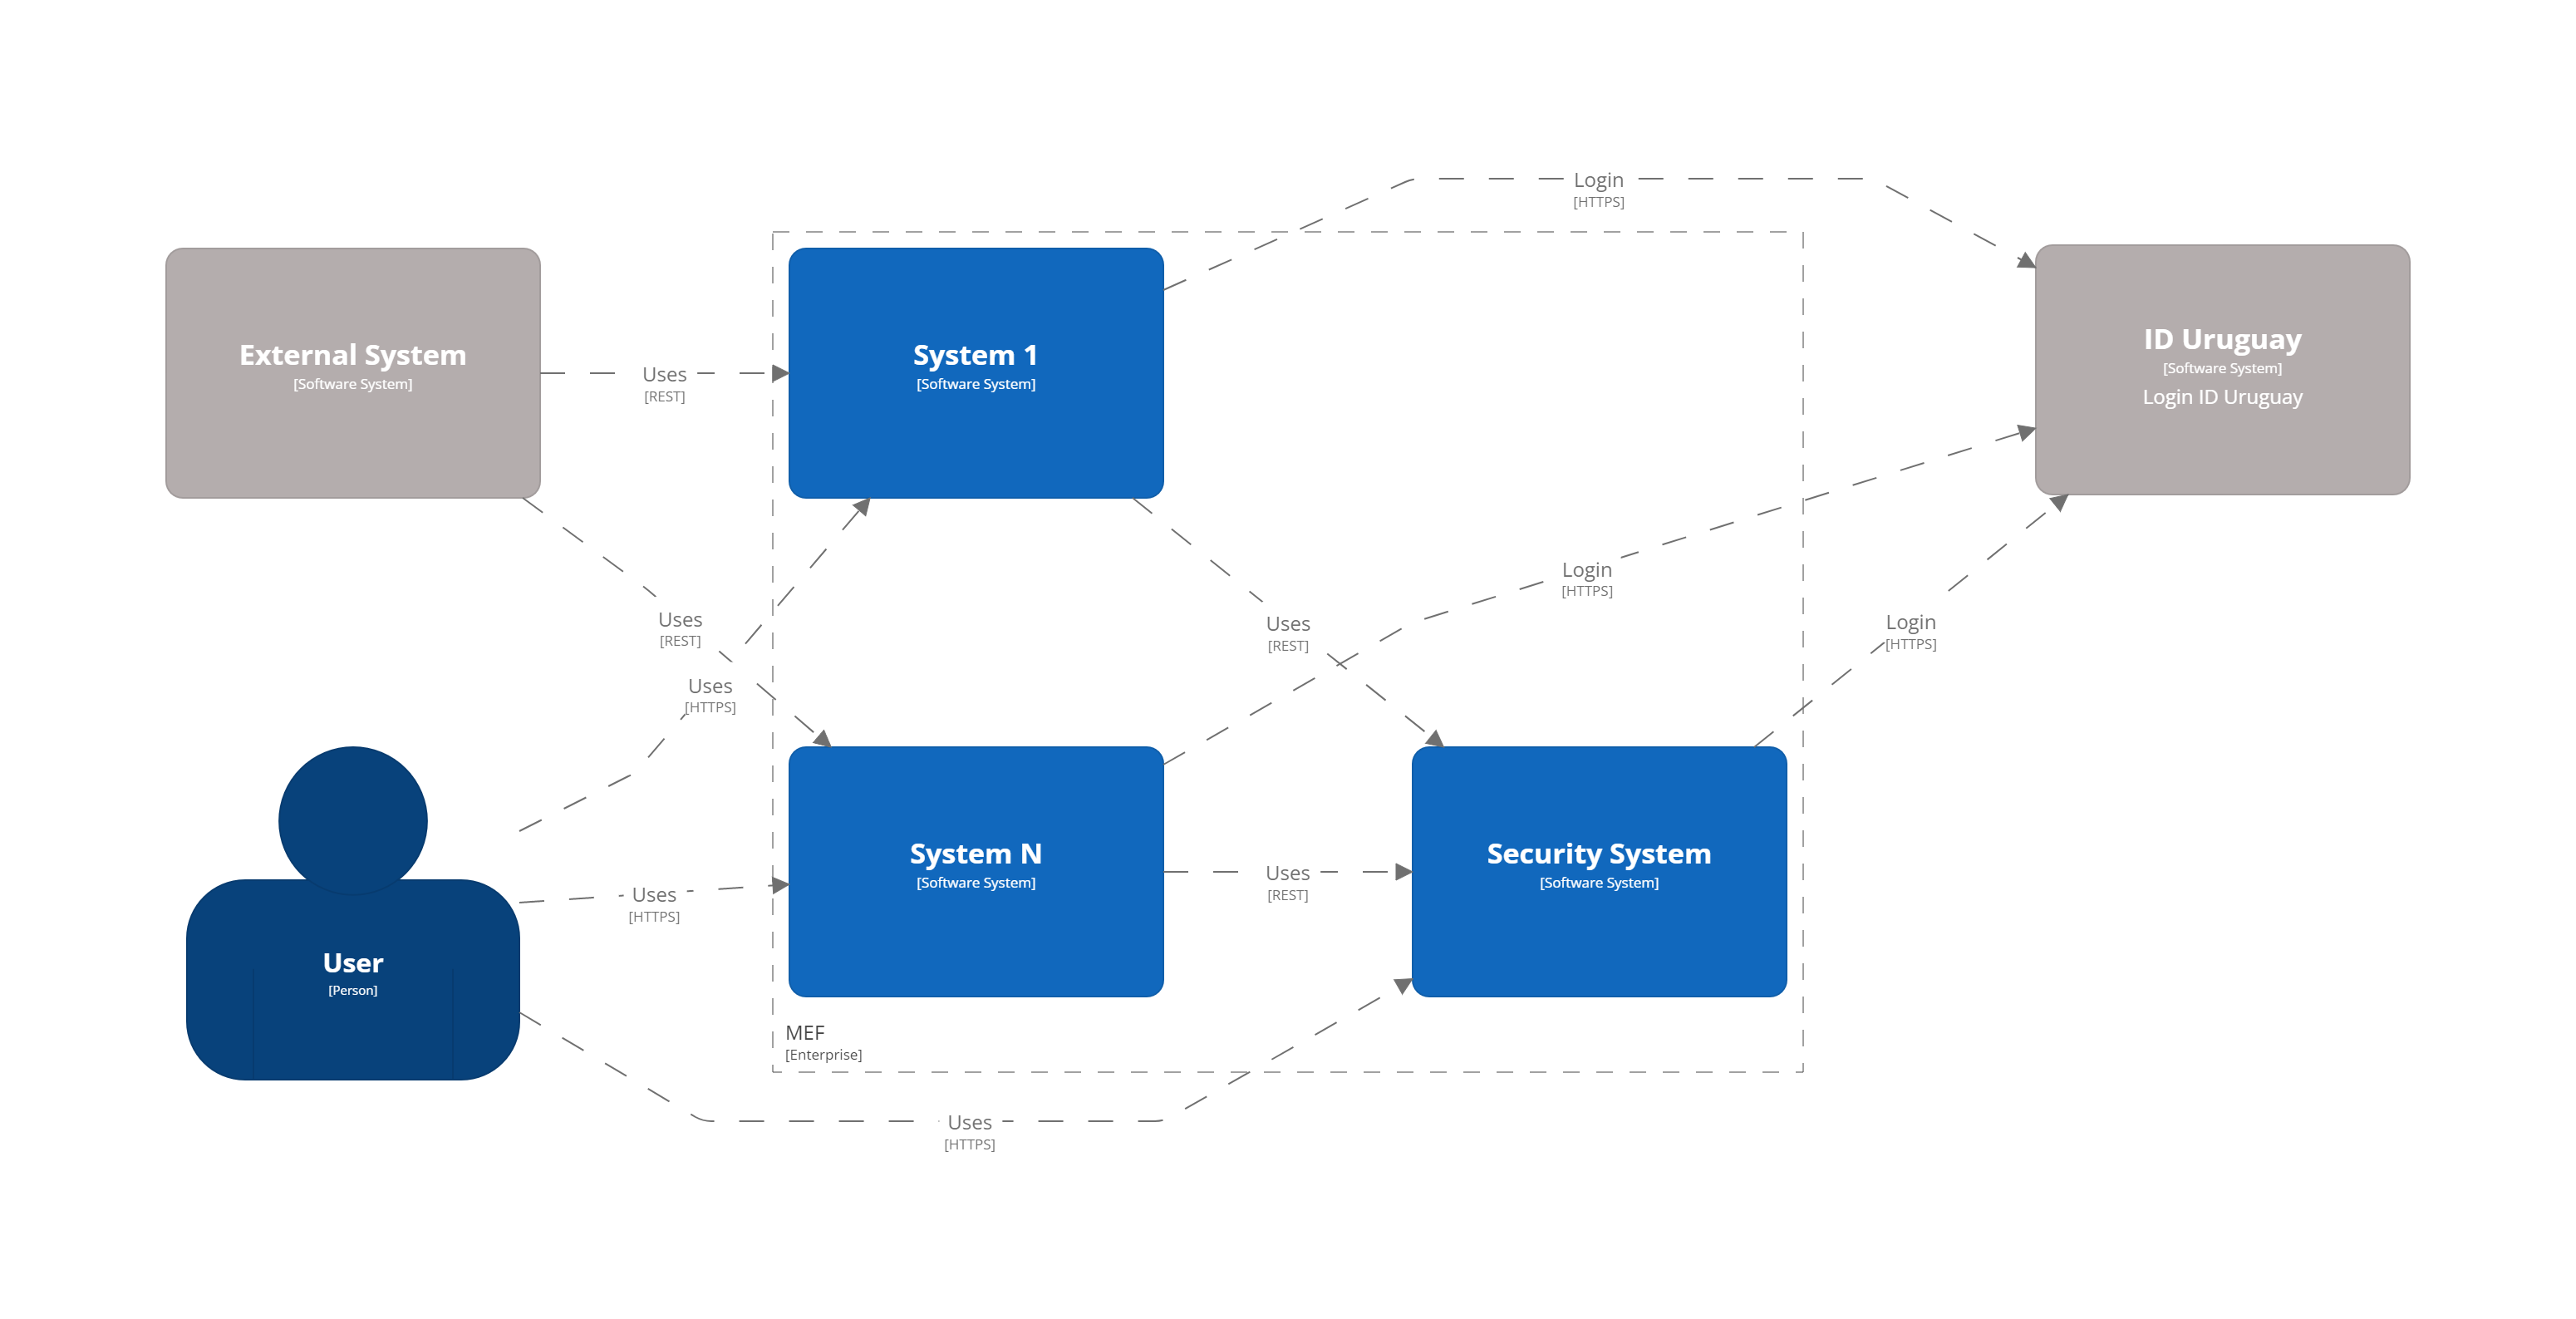
Description:
-
System 1 to N. Can be any of the systems used in MEF.
-
Security system. Management of users, roles, operations, audit logs, etc.
-
ID Uruguay. AGESIC Identity and Authentication Provider. Users must start an OAuth2 authentication flow against this provider via MEF applications.
-
External system. Represents an external system that consumes MEF APIs.
In addition to the internal systems, some of the most relevant tools we use are:
-
Kubernetes. Container orchestrator.
-
Ceph. Storage platform.
-
Elasticsearch, Fluentd, Kibana stack. Storage and visualization of log and audit data.
-
Prometheus, Alertmanager, Grafana stack. Visualization of infrastructure and services metrics. Also responsible for generating alerts.
-
Matomo. Used to obtain user analytics and their behavior on websites.
-
Apache Kafka. Distributed event streaming platform.
-
Apache APISIX API Gateway. Manage and expose APIs.
-
ArgoCD. GitOps continuous delivery tool.
-
GitLab. Code repository and CI/CD DevOps tool.
-
Nexus. Repository for libraries and Docker images.
-
SonarQube. Static code analysis tool.
Kubernetes
Kubernetes is an open-source container orchestration system for automating software deployment, scaling, and management. The combination of Quarkus and Kubernetes provides an ideal environment for creating scalable, fast, and lightweight applications. Our applications and tools are deployed in two on-premise Kubernetes clusters for production and non-production environments.
ArgoCD and Kustomize
ArgoCD is a Kubernetes operator that utilizes CRDs (Custom Resource Definitions) to configure its operation. These CRDs enable the definition of infrastructure through Git-stored files and automate deployment following any changes made.
Kustomize adheres to Kubernetes principles by leveraging Kubernetes objects to define configuration files and manage these configurations declaratively. A Kustomization object defines how to generate or transform other Kubernetes objects and is created in a file named kustomization.yaml, which can be edited by Kustomize itself. Kustomizations can be patched with overlays to overwrite base settings and create variants. ArgoCD offers seamless Kustomize support, allowing for more efficient and effective management of Kubernetes configurations.
Ceph
Ceph is an open source software-defined storage platform that implements object storage on a single distributed computer cluster and provides 3-in-1 interfaces for object, block and file level storage. We have two on-premise clusters (prod and non-prod) that are integrated with our Kubernetes clusters.
CI/CD
We are currently using a customized CI/CD flow based primarily on A successful Git branching model. All the CI/CD tasks are implemented using GitLab.
We follow the "build once deploy anywhere" approach whenever possible. The code is built using s2i (source to image) and the images are propagated through the different environments (development, integration, test/QA, training, preprod and production).
Our type of development requires us to have 3 unique long lived branches per project:
-
Main. Where all the developers continuously merge their new features.
-
Release. When the code in main is ready to be released to QA, it is merged to the release branch. Release can be evolved independently of main while bugfixes are applied.
-
Production. Where the code released to production is. Hotfixes branches are created from it.
Metrics
The Prometheus-Grafana combination has become one of the most popular solutions for monitoring, alerting, and visualization in the cloud-native space. Prometheus is an open source systems monitoring and alerting toolkit. Grafana is a multi-platform open source analytics and interactive visualization web application. It provides out of the box support to display data collected by Prometheus.
With them, we can gather, visualize and react to metrics from Kubernetes, CephFS, Apache APISIX, Elasticsearch, Kafka, Zookeeper, databases, backends, frontends and more.
To start exposing metrics with Quarkus, the quarkus-micrometer-registry-prometheus extension must be added. This allows us to get interesting metrics about our application as CPU, heap, non heap, http requests, etc. With the default HTTP metrics exposed, we are able to get the following insights by method:
-
Total number of requests
-
Maximum request duration
-
Average request duration
-
Sum of the duration of every request
To determine whether the maximum request duration is an isolated case or is occurring on many requests, percentiles must be used.
Percentiles
A percentile is a measure used in statistics indicating the value below which a given percentage of observations in a group of observations fall. For example, the response time for a HTTP request below which 90% of the response time values lie, is called the 90-percentile response time.
The recommended way to calculate percentiles is using the "Percentiles Histogram" approach. See https://docs.micrometer.io/micrometer/reference/concepts.html#_histograms_and_percentiles.
Quarkus (and Micrometer) let you enable this kind of metric by defining a @Singleton MeterFilterProducer. Example code below:
@Singleton
public class MeterFilterProducer {

    @Inject
    @ConfigProperty(name = "app.enable-percentiles-histogram", defaultValue = "true")
    Boolean enablePercentilesHistogram;

    @Produces
    @Singleton
    public MeterFilter percentilesHistogram() {
        return new MeterFilter() {
            @Override
            public DistributionStatisticConfig configure(Meter.Id id, DistributionStatisticConfig config) {
                return BooleanUtils.isTrue(enablePercentilesHistogram)
                        ? DistributionStatisticConfig.builder()
                                .percentilesHistogram(true)
                                .build()
                                .merge(config)
                        : config;
            }
        };
    }

}
With this new exposed metrics we can define, for example:
-
An alert in Prometheus that will fire when the 95 percentile request duration time is above 300ms.
histogram_quantile(0.95, sum(rate(http_server_requests_seconds_bucket[2m])) by (service, namespace, uri, method, le)) > 0.3 -
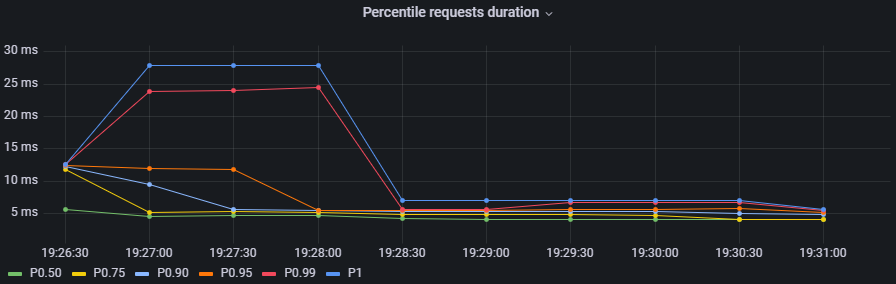
An interactive chart in Grafana to display some desired percentiles as 50, 75, 90, 95, 99 and 1:
histogram_quantile(0.90, sum(rate(http_server_requests_seconds_bucket{service="$application", namespace="$namespace", uri=~"$percentiles_uri", method=~"$percentiles_method"}[2m])) by (le))
Authentication and authorization
Our API security is implemented with Json Web Tokens. We have a centralized auth service that generates JWT, which are used by users and applications to consume the exposed APIs. Every backend has access to the public key and can validate the signature on their own. For protecting the endpoints, the @RolesAllowed annotation is being used. In addition to that, the quarkus-security extension must be added.
You may already be familiar with the "groups" attribute in JSON Web Tokens (JWTs), which typically maps to the @RolesAllowed property in many jwt-security validation libraries. However, this approach assumes that roles need to be hardcoded, which may not always be suitable. In our case, we wanted the security on the endpoints to be operation-oriented, so that a user can have dynamic roles, with different operations. To accomplish this:
-
Each endpoint must be mapped to a single operation.
-
A way to map between JWT groups and operations is needed. Storing operations in the groups attribute of a JWT is not ideal, as the array could be significant, resulting in a large token.
We decided to implement the JWT validation using a ContainerRequestFilter, as exposed in https://quarkus.io/guides/security-customization#jaxrs-security-context. In that filter the JWT groups are obtained and a cached method with @CacheResult is invoked to obtain the related operations.
As of today, we are using a memory cache with Caffeine for simplicity, but the new Redis as cache backend introduced in Quarkus 3 seems to be a good alternative, as we would be able to share the cache between all the instances. See https://quarkus.io/version/main/guides/cache-redis-reference.
The SecurityContext isUserInRole method is overrided as:
@Override
public boolean isUserInRole(String o) {
    return user != null ? user.getOperations().contains(o) : false;
}
Audit requests
A common requirement is to audit the requests that are made to our APIs. It was decided to:
-
Store it as data streams in Elasticsearch.
-
Store it asynchronously, without interfering with the request.
-
Always audit POST, PUT, PATCH, and DELETE methods. In a few special cases also GET methods.
We wanted to audit params like service, requestDate, responseDate, method, baseUri, path, queryParams, userId, ip, traceId, traceApplicationChain, responseStatus, requestBody (optional) and responseBody (optional).
For doing so, we implemented some utility classes:
-
A
ContainerRequestFilter, to get some params such as request start date and propagate them throughContainerRequestContext. -
A
ContainerResponseFilter, to get the rest of the params and invoke a method in charge of sending an audit event to a Kafka topic. We decided to send the event only in the response filter for performance reasons, assuming that there can be minimal loss if it is not invoked. -
An
@AuditedEndpointannotation, used to identify and customize the methods that we want to audit. The API methods not annotated, are ignored by the filter. This annotation has two boolean parameters that can be customized at method level:auditRequestBody(true by default) andauditResponseBody(false by default).
Sending an imperative event to Kafka can be done with an Emitter (see https://quarkus.io/guides/kafka#sending-messages-with-emitter). The quarkus-smallrye-reactive-messaging-kafka extension has to be added.
After we have the events in the topic, we need a way to process and store them in Elasticsearch. To perform this task, we are using the Elasticsearch Service Sink Connector deployed within Kafka Connect. Kafka Connect is a tool for scalably and reliably streaming data between Apache Kafka and other data systems. It makes it simple to quickly define connectors that move large data sets in and out of Kafka. See https://docs.confluent.io/platform/current/connect/index.html.
| In addition, we are also employing Hibernate Envers for entity-oriented auditing. |
| Besides audit event processing, Kafka will be used as a mechanism for communication between services (and systems) that have independent databases. |
Database schemas and migrations
We have several environments e.g. development, integration, test/QA, training, preprod and production. It is necessary to automate the execution of the scripts as the services are deployed in the different environments. Flyway is a great tool to achieve that. It allows you to:
-
Recreate a database from scratch.
-
Make it clear at all times what state a database is in.
-
Migrate in a deterministic way from your current version of the database to a newer one.
The quarkus-flyway extension is needed. When running tests, or deploying the service, the migration functionality will kick in to apply the necessary scripts.
Our custom case (1)
Our system types require having groups of services sharing a single database (see https://microservices.io/patterns/data/shared-database.html). Additionaly, in some cases, legacy databases exist. Recreating the full structure from scratch with new migrations is a difficult task.
Decisions and implications:
-
For legacy databases, a Flyway "baseline" should be created with the current state, and migrations applied after that point.
-
Each service has its own schema in the database and is responsible for its evolution. A
flyway_schema_historytable by schema is needed. -
In certain cases, a table in schema A can have a foreign key to schema B. Therefore, one service may need structures from another in order to run correctly. This enforces that the service owner of schema B must be released before the owner of schema A. As a common rule, we avoid if possible having bidirectional foreign keys between A and B.
-
Automated tests must run against an existing database with all the structures. A single backend cannot re-create the entire database. See [Automatic testing / Code analysis].
Note that when working with some databases like Oracle or MySQL, failed DDL migrations are not automatically rolled back. See https://flywaydb.org/documentation/learnmore/faq#rollback. We found two ways of mitigating this situation:
-
Run the tests in a environment where
quarkus.flyway.clean-on-validation-error=true. That allows to test all the migrations before releasing to another environment. Mostly useful in new services that do not share the database. -
Create independent migrations by feature. In this case, migrations should be small, and it will be easier to rollback. To avoid name collision between migrations of the same version, a timestamp in the name and
quarkus.flyway.out-of-order=truemight be used.
Our custom case (2)
The management of users, roles, operations of all the systems is handled in one transversal security management system with his own database. When a backend exposes a new API, it defines a new operation and a @RolesAllowed annotation. It might also need to create new roles if needed. This new data must be persisted/updated in the security system database. We need to trigger such updates as part of the service CI/CD flow. To resolve this situation, the services need two folders of migrations: db/migration (for the service schema) and db/migrationsecurity (for the security database). At the security database, each service has its own "flyway_schema_history" table, to keep record of the migrations executed. For example "fsh_service_A", "fsh_service_B", etc.
How do we do it? The default db/migration folder is handled by Quarkus when running tests or deploying. On the other hand, the db/migrationsecurity is picked up by a GitLab job that runs before deploying the app to any environment. As the security database is shared across all the services in that environment, the Flyway configurations can be declared in a unified way as GitLab CI/CD variables. Another approach thay may also work is using the quarkus.flyway."named-data-sources" properties, that let you apply migrations in different datasources.
Automatic testing and code analysis
To implement automated testing the quarkus-junit5 extension is needed.
As mentioned above, our automated tests have to run against an existing database with all the necessary structures. For that reason, we are not able to set up test databases from scratch, for example using TestContainers. We also need to have a way to rollback the changes introduced by tests. Doing the latter is really easy thanks to the @TestTransaction annotation provided by Quarkus (see https://quarkus.io/guides/getting-started-testing#tests-and-transactions).
Transactional testing is really useful, as it allows us to run tests against a real database, without the need for mocking. Along with testing the methods logic, it also guarantees that the entities and tables are correctly defined.
Regarding code analysis, we are using two Maven plugins: sonar-maven-plugin and dependency-check-maven. SonarQube is an open source platform developed by SonarSource for continuous inspection of code quality to perform automatic reviews with static analysis of code to detect bugs and code smells. Dependency-Check is a Software Composition Analysis tool that attempts to detect publicly disclosed vulnerabilities contained within a project’s dependencies. A plugin can be installed in SonarQube to integrate with dependency check reports.
The quarkus-jacoco extension is also used to get the coverage of the tests. The generated report is picked up by SonarQube, and the results are used to check against the quality gate.
Code analysis tools can take some time. For that reason, we decided to run this tasks only on nightly builds fired by GitLab scheduler. This decision depends on the requirements of each project.
Dependency Bot
We are living in an age of continuous delivery code, and Quarkus is no exception. The team is releasing new versions with improvements and bugfixes at a fast pace. In addition to that, we crafted some utility libraries that are shared among our backends and frontends. When there are new releases, all the services should be updated.
As of today (initial phase), we have ≈30 services, but a lot more are expected in the near future. Having a dependency bot to help us update these dependencies and run automated validation tasks is a must.
As we are working with GitLab, one of the recommended options is Renovatebot. See https://docs.renovatebot.com/. It is relatively easy to setup, works seamlessly with Java, and is highly customizable.
Security domains and DAO library
As part of the project, we had to code an utility JPA DAO library for simplifying the queries made by developers. As a result, the "jpacriteria-dao" library was born. Under the hoods, it uses the JPA criteria library.
The main goals are:
-
Simplify the creation of queries. Developers only need to code DTO filters and map the attributes to criteria predicates. The library creates the final query. It automatically detects when to do inner/left joins, when to use distinct, etc.
-
Support the use of
includeFieldswith navigation, so the developers can choose which fields to query (field1.field2.id,field1.field2.name, etc). Executes a native Query and maps the result to a DTO. It is very useful to limit the scope of the query. -
In our system, we have security domains, with precedence. Some users must only see the data that belongs to their domain. The library, when instructed, can do the validations and filtering automatically at DAO level. Entities that need to support that must extend the
DataSecurityinterface.
We decided to open source it, and it will probably be also deployed to Maven Central. The code is published in the https://github.com/sofisslat/jpacriteria-dao GitHub repository.
We also uploaded an example Quarkus app using the library (under the folder example). As of today, we see the library as a proof of concept, that can be evolved and improved.
Logs (EFK)
When running multiple services and applications on a Kubernetes cluster, a centralized, cluster-level logging stack can help to quickly sort through and analyze the heavy volume of log data produced by the pods. One popular centralized logging solution is the Elasticsearch, Fluentd, and Kibana (EFK) stack. Data streams are the recommended way of storing logs in Elasticsearch. In a typical setup, all the logs have useful context information used for filtering as "namespace", "service", "log level", etc.
The challenge lies in adding as much context as possible to the logged information, such as:
-
traceId (link logs corresponding to a trace of invocations)
-
tokenId (link logs corresponding to a JWT authorization token)
-
userId/userCode (link logs corresponding to a given user)
This additional information helps our development team to debug errors reported by users.
JSON logging format
It is possible to change the output format of the console log. This can be useful in environments where the output of the Quarkus application is captured by a service which processes and stores the log information for later analysis. In order to configure the JSON logging format, the quarkus-logging-json extension may be employed. See https://quarkus.io/guides/logging#json-logging.
In our case, this allowed us to add some extra parameters to the JSON log output, that are easily picked up by fluentd and sent to Elasticsearch.
The quarkus.log.console.json.exception-output-type=formatted property is also used to send the stacktrace.
| Docker has a size limit of 16K for logs (kubernetes/kubernetes#52444 and moby/moby#34620). An error with a large stacktrace is going to generate a split log. The proposed fluentd community solution is using the fluent-plugin-concat. Keep in mind that there are edge cases with rotating file logs when it might fail. Another solution is sending the logs directly as mentioned in https://quarkus.io/guides/centralized-log-management. |
MDC (Mapped diagnostic context)
The typical Java logging API lets you log the level, exception message and stacktrace. Quarkus uses JBoss Log Manager under the hoods. Using org.jboss.logmanager.MDC, we have access to the MDC.put(String key, String value) method that allows us to add key-value parameters.
In order to set this information, a javax.ws.rs.container.ContainerRequestFilter should be implemented.
Obtaining the parameters
The tokenId, userId and userCode are obtained from the JsonWebToken used to invoke the API.
The traceId, is generated by the quarkus-opentelemetry extension. The extension is responsible for transparently propagating the trace through the different REST invocations that are made from the backends. We wanted to use the traceId only for logging, without an external visualizing tool like Jaeger, so we disabled the OTLP Exporter with quarkus.opentelemetry.tracer.exporter.otlp.enabled=false.
Final thoughts
We initially adopted Thorntail (previously known as Wildfly-Swarm) for our service-oriented architecture projects, but switched to Quarkus at the beginning of its 1.x release due to its superior features. Quarkus has proven to be an excellent choice for us, and we have greatly enjoyed working with it and its extensions over the past few years. As of today, the new base architecture is already defined, and SIIF started its migration. At least 5 more years of work with it and other internal systems is expected. Undoubtedly, we will continue working and improving this architecture for the years to come, aligned with the Quarkus ecosystem. We extend our gratitude to the entire Quarkus team and the enthusiastic community behind the project, of which we are proud to be a part.