Monitoring Quarkus apps using Micrometer and Prometheus into OpenShift

Metrics are the measurements of any aspect of an application such as resource usage or behaviors. We can expose these metrics from our Quarkus applications by using the Micrometer extension via the /q/metrics endpoint.
What metrics will be exposed? Only by adding the Micrometer extension, a lot of metrics are exposed by default for example metrics about the JVM engine like the number of current live threads jvm_threads_live_threads or metrics about the system itself like the current CPU usage system_cpu_usage. Additionally, more metrics will automatically be exposed depending on other Quarkus extensions we might be using. For example, if we are using a Quarkus REST extension such as Resteasy, it will automatically expose metrics about your running services:
http_server_requests_seconds_count{method="GET",outcome="SUCCESS",status="200",uri="/hello",} 1.0
http_server_requests_seconds_sum{method="GET",outcome="SUCCESS",status="200",uri="/hello",} 0.018198043
The same will happen if we’re using the Kafka extension. All this configuration is well documented in the Quarkus Micrometer guide.
How are these metrics consumed? As said, Micrometer exposes the metrics on the /q/metrics endpoint in order to be consumed by third parties like Prometheus. OpenShift provides an embedded Prometheus instance that we can use. So, let’s see what we need to do to integrate our Quarkus Applications metrics and the Prometheus embedded instance provided in OpenShift.
Basically, we need to complete the next following steps:
-
Enable Monitoring for user-defined projects in OpenShift
-
Deploy our Quarkus application
-
Create a Service monitor in our project
Step 1 - Enable Monitoring for user-defined projects in OpenShift
In order to enable the Monitoring for user-defined projects, we need to follow the instructions from OpenShift documentation.
In essence, we need to create a ConfigMap in the namespace openshift-monitoring.
cluster-monitoring-config.yaml:
apiVersion: v1
kind: ConfigMap
metadata:
    name: cluster-monitoring-config
    namespace: openshift-monitoring
data:
    config.yaml: |
    enableUserWorkload: true
And apply it:
oc apply -f cluster-monitoring-config.yaml| For 4.5 or previous versions of OpenShift, you need to use instead: |
apiVersion: v1
kind: ConfigMap
metadata:
    name: cluster-monitoring-config
    namespace: openshift-monitoring
data:
    config.yaml: |
    techPreviewUserWorkload:
        enabled: true
Openshift will automatically create the openshift-user-workload-monitoring namespace and deploy the required resources for Prometheus to it.
2. Deploy our Quarkus application
After the required infrastructure in OpenShift is ready, then let’s continue with the Quarkus application. We’ll implement a REST API and enable micrometer with prometheus which requires the addition of two Quarkus extensions to our pom.xml file:
<dependency>
    <groupId>io.quarkus</groupId>
    <artifactId>quarkus-resteasy</artifactId>
</dependency>
<dependency>
    <groupId>io.quarkus</groupId>
    <artifactId>quarkus-micrometer-registry-prometheus</artifactId>
</dependency>
And we’ll add the Greeting resource:
import javax.inject.Inject;
import javax.ws.rs.GET;
import javax.ws.rs.Path;
import javax.ws.rs.PathParam;

import io.micrometer.core.instrument.MeterRegistry;
import io.micrometer.core.instrument.Tags;

@Path("/hello")
public class GreetingsResource {

    @Inject
    MeterRegistry registry;

    @GET
    @Path("/{name}")
    public String sayHello(@PathParam(value = "name") String name) {
        registry.counter("greeting_counter", Tags.of("name", name)).increment();

        return "Hello!";
    }
}
As we can see, we use the micrometer registry facade to create a counter with a tag by name that will be incremented every time it’s invoked.
Let’s try this application by running it:
mvn compile quarkus:devNow, we should be able to call our service:
curl http://localhost:8080/hello/quarkusAnd it should return Hello!. So good so far, we can also see the metrics in http://localhost:8080/q/metrics where should see our greeting_counter counter:
# HELP greeting_counter_total
# TYPE greeting_counter_total counter
greeting_counter_total{name="quarkus",} 1.0
Next, we need to deploy our Quarkus application into OpenShift. For ease this step, Quarkus provides a super useful extension called quarkus-openshift, let’s add it into our pom.xml file:
<dependency>
    <groupId>io.quarkus</groupId>
    <artifactId>quarkus-openshift</artifactId>
</dependency>
So, let’s deploy our application into a newly created project my-project in OpenShift:
oc new-project my-project
mvn clean package -Dquarkus.kubernetes.deploy=true -Dquarkus.openshift.expose=true -Dquarkus.openshift.labels.app-with-metrics=quarkus-app
The label app-with-metrics will be used in a later step to select the applications to monitor by OpenShift.
3. Create a Service monitor in our project
Before moving forward, let’s explain first how Prometheus works. Prometheus uses a pull model to get metrics from applications. This means that Prometheus will scrape or watch endpoints to pull metrics from.
From the previous step, our service is now running in OpenShift, but we didn’t configure anything in Prometheus to scrape our service yet. This is done by the Service Monitor resource:
service-monitor.yaml:
apiVersion: monitoring.coreos.com/v1
kind: ServiceMonitor
metadata:
  labels:
    k8s-app: prometheus-app-monitor
  name: prometheus-app-monitor
  namespace: my-project
spec:
  endpoints:
  - interval: 30s
    targetPort: 8080
    path: /q/metrics
    scheme: http
  selector:
    matchLabels:
      app-with-metrics: 'quarkus-app'
The path /q/metrics is the default metrics endpoint in Quarkus.
We could configure the /metrics endpoint Prometheus expects in application.properties instead of adding the path attribute above using the following property: quarkus.micrometer.export.prometheus.path=/metrics.
And apply it:
oc apply -f service-monitor.yamlWhat we have just done is to create a Service Monitor named prometheus-app-monitor that will select apps with the label app-with-metrics: quarkus-app that was added in the previous step. Then, OpenShift will call the endpoint /q/metrics for all the services labeled with app-with-metrics: quarkus-app every 30 seconds.
Finally, let’s start using it!
First, we need to call our greetings service: http://quarkus-micrometer-my-project.ocp.host/hello/quarkus. This will increment the greeting_counter_total counter. But where can we see the metrics? Let’s browse to OpenShift Console in the Developer > Monitoring view, select Metrics, then Custom Query and type greeting_counter_total{name = "quarkus"}, we should see now:
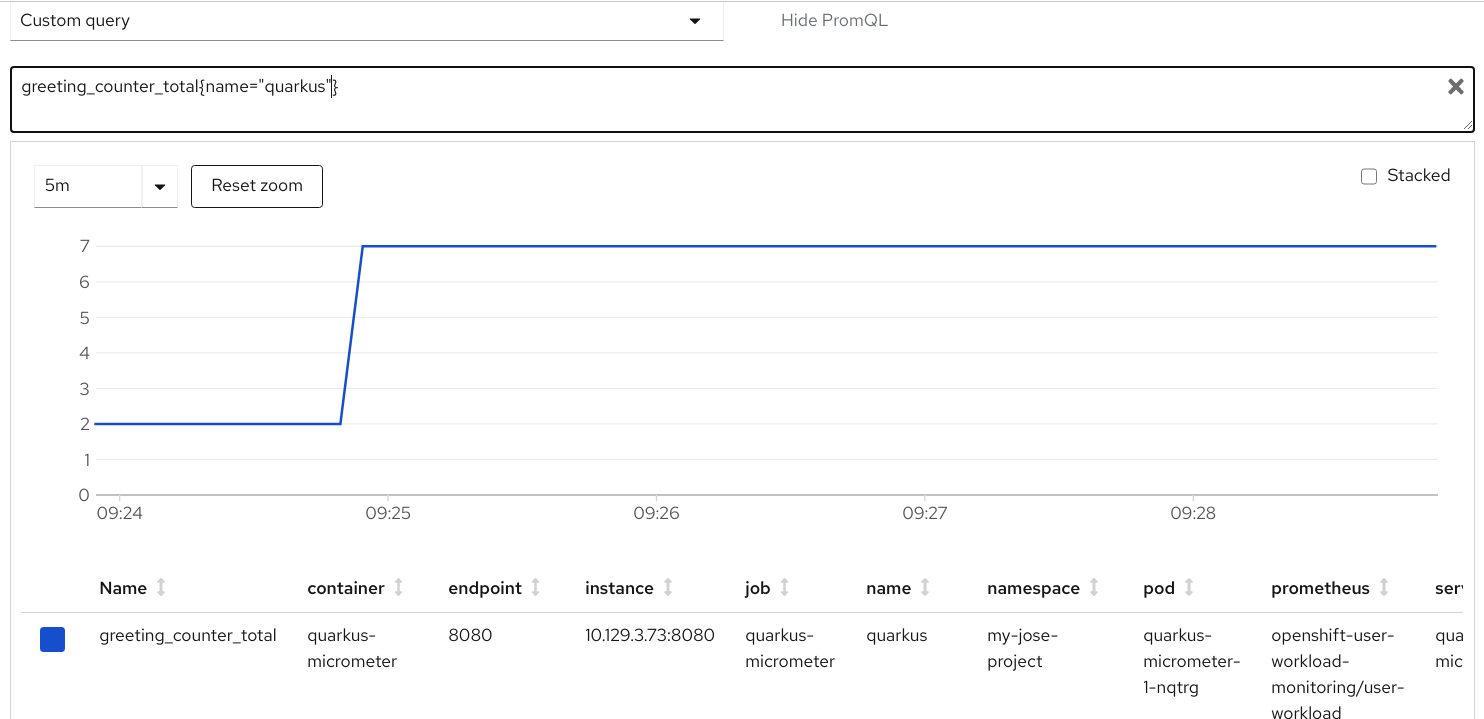
Great! We are now exposing our Quarkus Application metrics in OpenShift!