Quarkus Runtime Performance

This the first part of a blog series that delves deeper into Quarkus performance. There are many aspects to the performance of a framework from bootstrap time to memory usage, compile time and runtime performance.
The definition of "performance" is contextual and these series of blog posts aims to investigate the performance of Quarkus in varying contexts.
This article will focus on runtime performance of applications built with Quarkus.
tl;dr - Summary
A REST application that retrieves data from a postgres database using transactions was created to compare the throughput and response latencies of Quarkus and Thorntail. The application was put under varying degrees of load, to demonstrate how Quarkus scales.
Quarkus running in native mode, supporting 40 concurrent connections, has shown to provide up to an 38.4% increase in maximum throughput whilst reducing maximum response time latencies by up to 42.7% compared to Thorntail for a single process.
Quarkus running in JVM mode, supporting 40 concurrent connections, has shown to provide up to an 136% increase in maximum throughput whilst reducing maximum response time latencies by up to 66.3% compared to Thorntail, for a single process.
Quarkus running on the JVM provides improved throughput and response time compared to Native mode for a single process, but uses up to 277% more memory (RSS).
For applications running in containers, constrained to 2048MB of RAM, it is theoretically possible to improve application throughput by up to 177.3% by running multiple instances of a Quarkus application in JVM mode, or 545% running multiple Quarkus instances in Native mode, compared to a Thorntail application.
Native images are not just for short running processes. The tests ran for up to 3 hours, without process restarts, and the native image served over 33 MILLION requests!
One size does not fit all! Quarkus gives you the option to scale up in JVM mode if you need a single instance with a larger heap, or scale out in Native mode if you need more, lighter-weight instances
Elephant in the Room
"It’s all well and good optimizing for bootstrap start-up times and image size, but response time is still important".
Let us first address the elephant in the room, Quarkus has so far been focused on start-up time and Memory Footprint.
"That’s because native performance sucks right?!" Wrong!
By running a sample application, retrieving data from a PostgreSQL database via transactional REST HTTP requests, I will address
-
Single process Throughput and Reponse Time in Native mode and JVM mode, compared to Thorntail
-
Native images for long running processes
Details of the application and test methodology can be found at the end of this post in the Test Application section.
What does Quarkus give you?
Quarkus provides you with a choice of 2 run modes. You can either run as a native binary or as bytecode on a JVM.
That means you can choose the runtime that meets your needs for your application. If a native image doesn’t give you what you need, no problem, choose your favourite JVM.
But don’t think that running on the JVM is a second rate citizen, Quarkus is optimized for running on the JVM as well as in native mode
Why compare with Thorntail?
Thorntail is a more traditional cloud-native stack that has its base from the WildFly community and we decided that it’s fair to compare with a runtime that we know how to optimize. The point of this performance test is not to compare frameworks vs framework, but to show that the optimizations done in Quarkus goes beyond just startup time and initial memory consumption. Thorntail is a great runtime, but just like other traditional cloud-native stacks the runtime dynamics behavior that wasn’t a concern on a standalone deployment is turning out to be a cause of significant overhead for modern deployment scenarios.
Throughput (Req/Sec)
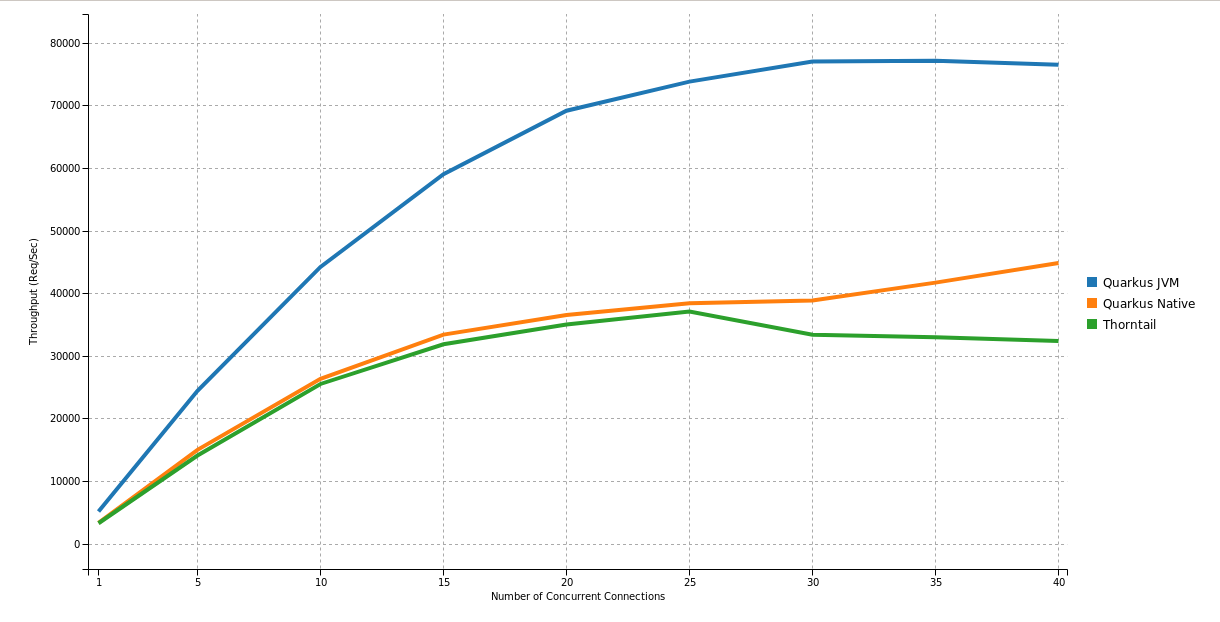
Maximum throughput, measured in requests per second (Req/Sec) tells us the maximum number of request the single process application can service per second. The higher the maximum throughput, the better.
Comparing a native Quarkus application to Thorntail running on a JVM, the maximum throughput is consistent as the number of concurrent users increases.
|
Quarkus 0.18.0, running a single instance in Native mode with 40 concurrent connections, provides a 38.4% increase in maximum throughput compared to Thorntail 2.4.0.Final running on the JVM. |
|
Quarkus 0.18.0, running a single instance in JVM mode with 40 concurrent connections, out-performs Thorntail 2.4.0.Final by 136%. |
| Concurrent Connections | Thorntail | Quarkus - Native | Quarkus - JVM |
|---|---|---|---|
1 |
3,273 |
3,316 |
5,138 |
5 |
14,092 |
14,998 |
24,417 |
10 |
25,512 |
26,328 |
44,196 |
15 |
31,855 |
33,389 |
59,007 |
20 |
35,006 |
36,515 |
69,146 |
25 |
37,082 |
38,416 |
73,790 |
30 |
33,369 |
38,849 |
76,992 |
35 |
32,974 |
41,691 |
77,118 |
40 |
32,391 |
44,841 |
76,488 |
Response Times (ms)
I would like to start this section with the statement that "Everything You Know About Latency Is Wrong" [1]
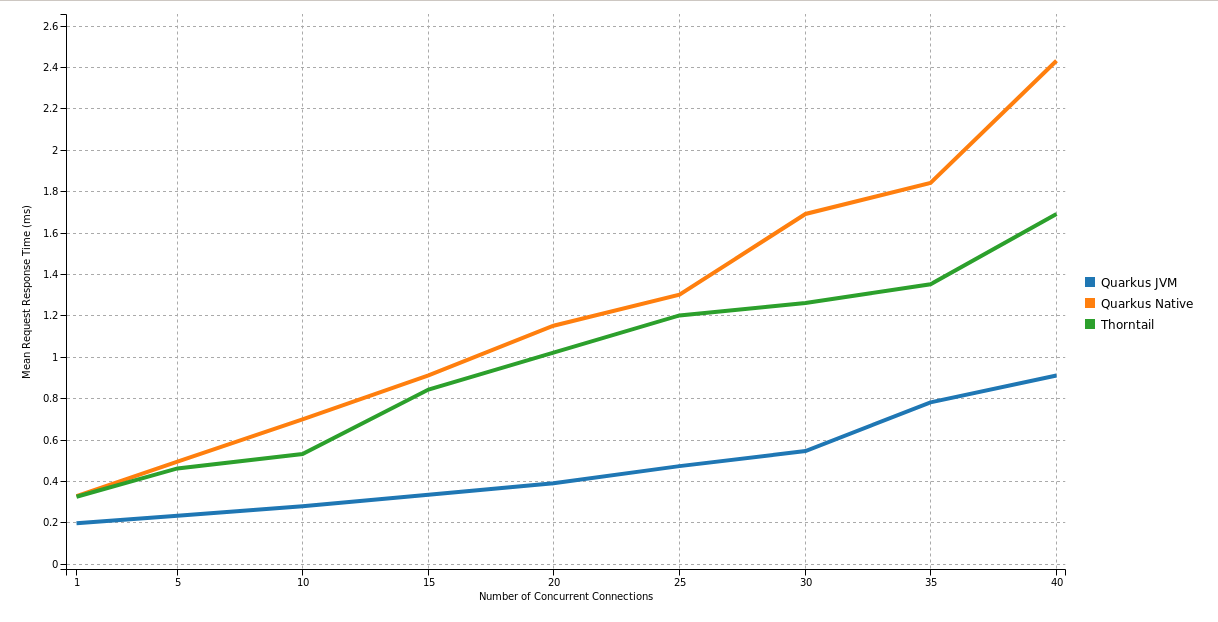
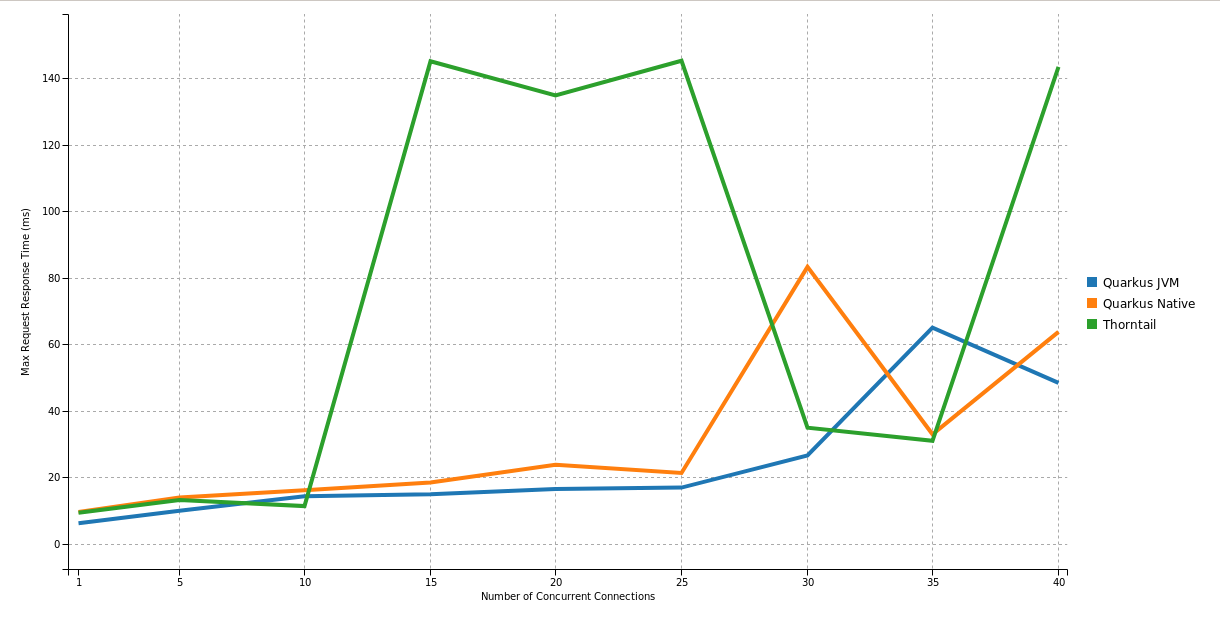
Response time is a measure of the time it takes for the application to respond to a request. The lower the response time, the better. But mean response time is not the overall picture of application responsiveness. Maximum response time tells us more about user experience than mean response time.
Why is this important? Maximum response time tells us the worst case scenario, and between 26-93% of page loads will experience the 99th centile response time [2]. Having a super low, super stable maximum response latency increases application responsiveness.
Under high numbers of concurrent users; Mean response time for Quarkus in JVM mode is 0.91ms vs 1.69ms for Thorntail. When running in Native mode, mean response time shifts to 2.43ms in exchange for the lower memory utilization.
If we look at the Maximum response time; Thorntail took 145.3ms to service at least one request, compared to 65.01ms for Quarkus JVM and 83.27ms for Quarkus Native.
|
The maximum response time for Quarkus in native mode is super-stable and up to 42.7% lower than Thorntail. |
|
The lower mean response time latencies running on the JVM are due to the GC implementations available in the JVM are superior to the GC implementation currently available in GraalVM. Quarkus is currently still a Beta release, and improvements are planned for running in native mode |
| Concurrent Connections | Thorntail (mean) | Thorntail (max) | Quarkus - Native (mean) | Quarkus - Native (max) | Quarkus - JVM (mean) | Quarkus - JVM (max) |
|---|---|---|---|---|---|---|
1 |
0.324 |
9.31 |
0.327 |
6.13 |
0.196 |
9.52 |
5 |
0.461 |
13.12 |
0.494 |
9.86 |
0.232 |
13.85 |
10 |
0.53 |
11.3 |
0.698 |
14.24 |
0.278 |
16.08 |
15 |
0.842 |
145.16 |
0.91 |
14.86 |
0.334 |
18.38 |
20 |
1.02 |
134.9 |
1.15 |
16.4 |
0.389 |
23.7 |
25 |
1.2 |
145.3 |
1.3 |
16.86 |
0.472 |
21.25 |
30 |
1.26 |
34.87 |
1.69 |
26.52 |
0.545 |
83.27 |
35 |
1.35 |
30.94 |
1.84 |
65.01 |
0.78 |
32.9 |
40 |
1.69 |
143.49 |
2.43 |
48.37 |
0.91 |
63.71 |
Application Start Time
start-up times and memory usage were measured for each runtime using the method described here https://quarkus.io/guides/performance-measure
| Metric | Thorntail | Quarkus - Native | Quarkus - JVM |
|---|---|---|---|
Start Time |
8764 ms |
18 ms |
1629 ms |
Maximum Memory Usage
Memory for each application process was measured with ps
$ ps -o rss -p <PID>The maximum memory usage during the runs was captured.
| Thorntail | Quarkus - JVM | Quarkus - Native |
|---|---|---|
651 MB |
414 MB |
122 MB |
|
Compared to Thorntail, Quarkus in native mode used only 18.7% of memory to service 20.9% more requests and Quarkus in JVM mode used 63.6% of memory to service 108.0% more requests |
Therefore, using a machine with 2048MB of memory, running more than one process (not constrained by CPU), it should be possible to achieve the following increases in throughput over Thorntail;
| Runtime Mode | Memory (MB) | Number processes per 2048MB | Max Throughput per Process (Req/Sec) | Overall Max Throughput (Req/Sec) | Compared to Thorntail |
|---|---|---|---|---|---|
Thorntail |
651 |
3 |
37,082 |
111,246 |
100% |
Quarkus - JVM |
414 |
4 |
77,118 |
308,472 |
277% |
Quarkus - Native |
122 |
16 |
44,841 |
717,456 |
645% |
|
For applications running in cloud environments, it is theoretically possible to improve application throughput by up to 545% for the same amount of memory by running multiple instances of a Quarkus application in native mode. |
Quarkus native - Long running processes
Another concern is that Quarkus running in native mode is not suitable for long running processes.
|
During testing, Quarkus was running in native mode for more than 3hrs at a time, and serviced over 51,890,000 requests! |
These requests caused hundreds of Full GC cycles, and the process remained stable throughout.
Test Application
The test application is a Transactional REST/JPA application that makes calls to a PostgreSQL database. The application and database were both running inside a Docker container.
Sources are available here: https://github.com/johnaohara/quarkusRestCrudDemo
Building and Running test Application
Build;
Quarkus JVM
 $ cd ./quarkus
 $ build-quarkus-jvm.sh
or Quarkus Native
 $ cd ./quarkus
 $ build-quarkus-native.sh
or Thorntail
 $ cd ./thorntail
 $ ./build-thorntail.sh
Run;
First start PostgreSQL running in a Docker container;
docker run -d --rm -p 5432:5432 --network host  \
	-e POSTGRES_DB='rest-crud' \
	-e POSTGRES_USER='restcrud'  \
	-e POSTGRES_PASSWORD='restcrud' \
	docker.io/postgres:10.5
then start the application running in a Docker container;
 $ cd ./quarkus
 $ ./run-quarkus-jvm.sh
or Quarkus Native
$ run-quarkus-native.shor Thorntail
 $ cd ./thorntail
 $ ./run-thorntail.sh
Runtime validation
Navigate browser to http://{REMOTE_HOST}:8080/
or
$ curl -D - http://{REMOTE_HOST}:8080/fruits

HTTP/1.1 200 OK
Connection: keep-alive
Content-Type: application/json
Content-Length: 75
Date: Mon, 01 Apr 2019 07:57:17 GMT

[{"id":2,"name":"Apple"},{"id":3,"name":"Banana"},{"id":1,"name":"Cherry"}]
Runtime Performance Metrics
Throughput and Response Time were measured using the wrk command line tool https://github.com/wg/wrk.
A shell script for running wrk is provided;
$ ./runWrk.shRuntime Environment
System Under Test
CPU: 32 x Intel® Xeon® CPU E5-2640 v3 @ 2.60GHz
Operating System: Red Hat Enterprise Linux Server release 7.6 (3.10.0-693.25.2.el7.x86_64)
Memory: 262GB
Ethernet: Solarflare Communications SFC9020 10G Ethernet Controller
