Quarkus has great performance – and we have new evidence

tl;dr
Performance is important to Quarkus, but our published performance graphics were outdated and missing important information (such the fact that we have fantastic throughput). To fix that, we built a new benchmark that is transparent, reproducible, and measures the full performance picture. In our experiments, Quarkus can handle 2.7 times more transactions per second than Spring Boot, as well as starting 2.3 times faster, all in half the memory.
The start of the story
If you’ve ever visited the quarkus.io site (and of course you have, because you’re here), you’ll probably have spotted the performance charts near the bottom of the front page. The Quarkus team are proud of our performance, because good performance means high scalability, low latency, low resource usage, lower costs, and better sustainability. Basically, performance matters. This is what we used to show:
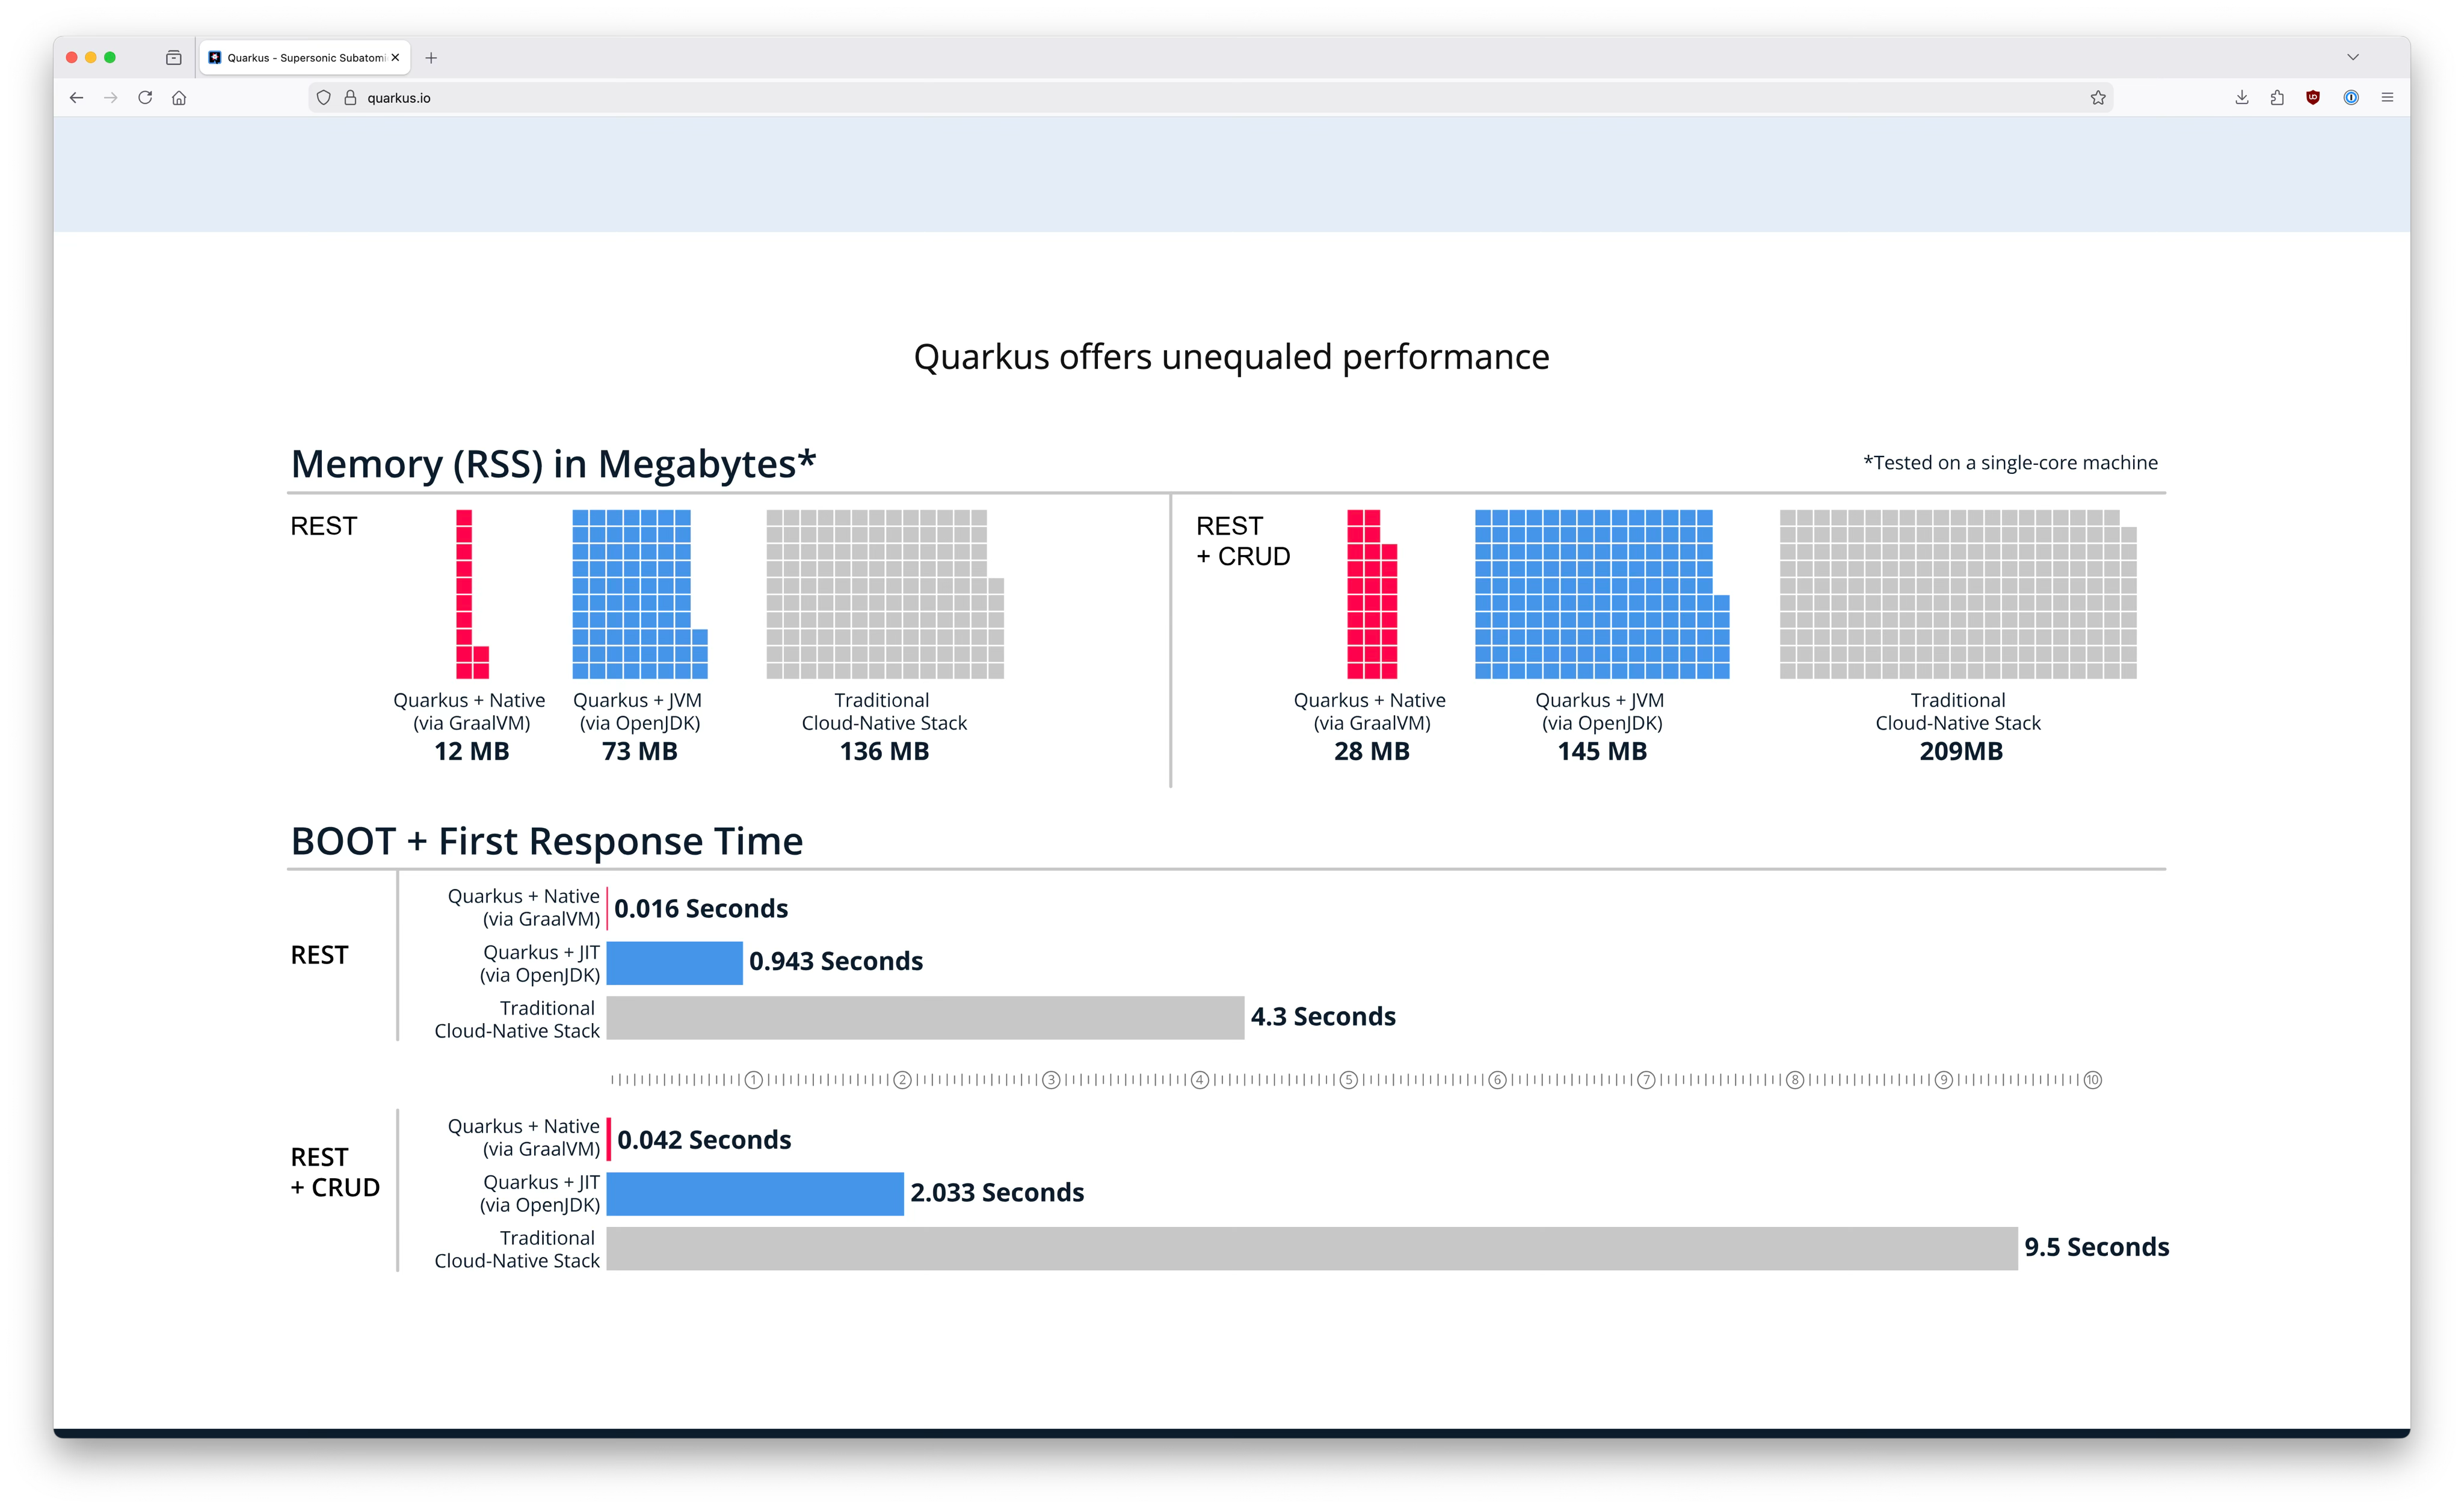
But despite the importance of performance, our performance charts had a few problems. Firstly, the numbers are out of date. How out of date? Well, it’s hard to say, because there’s no date on the chart. In fact, there’s no information at all about how the numbers were measured, and no link to the benchmark source code. This means no one can reproduce it, which means no one can validate. If it’s not reproducible, it’s not trustworthy.
Why didn’t we just link to the benchmark source code? Historically, we’ve been deliberately vague about what we were comparing against (manners!). Sharing the source code would have made it totally obvious what the other framework was. As well as preventing us from the sharing of the benchmark source, anonymizing the other framework had its own problems. Not sharing the framework name is polite, but it means we’re not giving readers useful information to make an informed choice of framework. Is Quarkus better? Oh yes, definitely. Better than what? Shhh, that’s a secret.
But there’s an even bigger problem with our old graphics, in my view. We show Quarkus starts fast, and we show it has a small footprint. We do not show anything about throughput. There’s a classic performance tradeoff between throughput and memory footprint or startup time. It’s easy for people looking at the charts to assume that if Quarkus doesn’t show its throughput figures, they must be terrible, right? Wrong! For Quarkus, there is no trade-off. Quarkus is more efficient than alternatives across the board. (Want to know where trade-off strikes back? Read on.)
But this misconception that Quarkus must have bad throughput turns up all over the place. It keeps popping up in external blogs, and if you ask your favourite AI service about the advantages of Quarkus, it’s unlikely to mention throughput. Instead, it will focus on startup time or memory. Those are important, but so is throughput.
There’s another, more subtle, omission in our charts that also contributes to misunderstanding about Quarkus. We show the performance of Quarkus in native mode, but we don’t show the performance of the other framework in native mode. Some people take this to mean that Quarkus is all about native mode, and if they’re using Quarkus, they should be using native mode. We often see blogs which compare Quarkus in native mode to other frameworks in JVM mode, which is just silly. Quarkus in JVM mode should be compared to other frameworks in JVM mode, and Quarkus in native mode should be compared to other frameworks in native mode. Quarkus happens to be very good at native mode, but whether you want to use native mode is an orthogonal choice to what framework you choose.
Because of all these problems, several members of the Quarkus community have ended up their own benchmarks to use in conference talks, or for demos. I’ve done it myself, in fact. Having members of the same team re-doing similar work is wasteful. What’s more, benchmarking is hard! Getting numbers is trivially easy, but getting numbers which are actually measuring what you think you’re measuring is hard. Doing it really really right needs the sorts of skills performance specialists have.
Ok, so we definitely needed a new benchmark
Something had to be done. Luckily, my colleague Eric Deandrea had been working on this exact problem for several years. Eric had a benchmark, based on an earlier one from John O’Hara, and he’d built up a set of automations which allowed measurements to be run in our performance lab, under controlled conditions.
Eric and I set up a new repository, moved Eric’s benchmark code into there, and refined the automations to push results out past the lab’s firewall to another repository, acting as a data store. We got numbers, and (after a bit of work with Apache Batik), pictures! Notice how great Quarkus’s throughput is. Quarkus can handle 2.7 times (19255 vs 7238 tps) more transactions per second than Spring Boot, as well as starting 2.3 times (2.919s vs 6.569s) faster, all in half the memory (269 MB instead of 583 MB).

This was when the real work began. With the benchmark now open sourced, it was open to scrutiny in a way it hadn’t been before. (This, of course, is part of the magic of open source.) Francesco Nigro, one of our Quarkus performance experts, spotted some areas where measurements could be made more robust. For example, our setup used cgroups with cpuset to pin processes to specific CPU cores — which is the right approach — but both the application under test and the load generator ended up in the same cgroup, competing for those same cores. With the load generator configured to use 16 threads, this introduced significant noise in the measurements. Switching to separate core assignments fixed that, though other sources of interference remained, such as the database not having its own dedicated cores and a cache-drop step that was inadvertently affecting every process on the host. Once proper isolation was in place, the throughput results shifted — and in a subtle way. Before the fix, slower frameworks appeared competitive because their lower load left more breathing room for the other processes. They were being flattered by the very contention they were causing less of. The chart above reflects the improved setup. This is what I meant earlier about benchmarking requiring skill — these mistakes are easy to make and subtle to detect.
But the best help came from outside the Quarkus community. Our intention with the benchmark was to replicate the experience of a normal user, not to tune each framework to within an inch of its life. (There’s TechEmpower for that.) Measuring the "out of the box" performance seemed like the best route, partly because the sort of performance most people will experience by default, and also because it was most fair. Fairness was a strong goal, because otherwise, what’s the point in comparing? Our team have the skills to tune Quarkus applications to razor-sharp performance, but most of us don’t have those same skills for Spring. It’s just not in our job description. Tuning Quarkus but not Spring would clearly not be fair.
But after we’d started publishing the first set of results, we were approached by people who used Spring Boot every day. They pointed out that there were differences in how the two frameworks handled open-session-in-view settings, and connection pool sizes. These differences were significant enough that we started to evaluate whether comparing the out-of-the-box behaviour actually was the fairest option. It turns out that open-session-in-view settings and fixing the N+1 problem didn’t make much difference to the numbers, but adjusting connection pool sizes did. In its default configuration, the Spring application was suffering from serious connection errors. If the client can’t connect, there’s no throughput, so the errors were lowering throughput. Eric, Francesco, and Sanne Grinovero spent a lot of time digging into the logs and profiling to work out configuration tweaks to ensure the Spring application could handle the load without errors.
Our Spring friends told us that these sorts of adjustments would be completely standard. We still wanted to measure out of the box performance, so we settled on a compromise. We measured both out of the box, and a lightly tuned version. In the graphics we show on the front page, we’re showing the tuned version. Here’s the tuned equivalent of the out of the box results above, for the same code level and scripts:

You can see that the effect of the tuning was pretty modest, overall. Notice, as well, that there was a bit of a trade-off between throughput and memory footprint; for both frameworks, the tuning optimisations ended up sacrificing some memory to improve speed.
Guiding principles
In trying to decide how to handle the question of tuning, we ended up referring back to the guiding principles for the whole exercise. They were:
Parity
The application code in the Spring and Quarkus versions of the application should be as equivalent as possible to perform the same function. This means the domain models should be identical, and the underlying persistence mechanisms should be identical (in our case, JPA with Hibernate). Performance differences should come from architecture differences and library-integration optimisations in the frameworks themselves. If a change is made that changes the architecture of an application (i.e. moving blocking to reactive, using virtual threads, etc), then these changes should be applied to all the versions of the applications.
Exploring our performance
One of the nice things about this work is that it’s allowed us to explore various performance-related questions, beyond just "does Quarkus have awesome performance?" For example, would running with virtual threads affect the results? Yes! Virtual threads added about 6k transactions per second, for all frameworks.

And we had more questions, too. Was there a performance difference between Spring Boot 3 and Spring Boot 4? It turns out things got better in some ways, and worse in others. Spring 4 gives higher throughput than Spring 3, but at the expense of a slower time to first response, and a higher memory footprint.

What would Quarkus' new AOT packaging do for startup times? (We’re still working on that one, but I’m excited to see the answer.)
The throughput vs startup tradeoff, revisited
I mentioned that with Quarkus, there was no trade-off between startup time and performance. When compared to other frameworks, this is definitely true. The internal efficiencies of Quarkus, like the build-time principle, improve both startup time and throughput. But if you compare Quarkus on JVM against Quarkus native, the trade-off is back! When using GraalVM to compile Quarkus applications to native, Quarkus starts faster than a lightbulb, and has a pretty small memory footprint. But there is a throughput penalty. Going native cuts throughput in half. (For Spring Boot, the native penalty is similar.) For most applications, this trade-off isn’t worth it, especially when combined with the longer build times and extra constraints of native. But sometimes, the trade-off is worth it: if your application gets started and stopped super-often or has very low workloads, use native.
Want to try the benchmarks at home?
You can! All of the source code and scripts are available at https://github.com/quarkusio/spring-quarkus-perf-comparison. Easy reproducibility for everyone was an important guiding principle when we designed the benchmark, but it does get kind of complicated. In the performance world, "rigorous" and "easy" do not go in the same sentence. As someone who always wants to make hard things accessible, this really frustrates me. In the end, we’ve ended up with a compromise. If you happen to have a performance lab handy, this is of course ideal. All of the scripts are available for you to run the jobs on your own hardware. If you don’t have that kind of setup, but do have a Linux machine, you can still use the expert-approved scripts we use. Under the covers, they use tools like qDup for orchestration and Hyperfoil to drive load without risking coordinated omission, and ensure process isolation.
But what if you want something really easy? At this point, things get harder. We created a second version of the scripts which are optimised for simplicity. They use only familiar tools, and don’t attempt process isolation. Because of this, they can be run on both Mac and Linux, and, with the right terminal, Windows. The results need to be treated with caution; laptop power management can cause all sorts of wild effects, and if the load is too much or too little, you might end up measuring a bottleneck which has nothing to do with Quarkus or Spring. We’re planning another blog (or six!) on how to avoid the most common problems, and how to tell if you’re measuring what you think you are.